


$75K+ a Year Just to Get By: The Most Expensive U.S. Counties Ranked
The cost of living in the United States has surged in recent years. Due in part to pandemic-related supply constraints and rising demand, the consumer price index surpassed the Federal Reserve’s 2% target rate in March 2021, and has remained above that threshold ever since. This historic inflation has had a tangible impact on millions […] The post $75K+ a Year Just to Get By: The Most Expensive U.S. Counties Ranked appeared first on 24/7 Wall St..

The cost of living in the United States has surged in recent years. Due in part to pandemic-related supply constraints and rising demand, the consumer price index surpassed the Federal Reserve’s 2% target rate in March 2021, and has remained above that threshold ever since. This historic inflation has had a tangible impact on millions of Americans.
Key Points
-
Historic inflation in the COVID-19 era has driven the cost of living in the United States up by well over 20% in the last half decade.
-
While rising prices have a direct impact on every American, consumer prices can vary considerably at the local level — and across the country, there are counties where consumers are paying far more than a typical American for the same goods and services.
-
Consulting a professional advisor can help you achieve financial security and independence. Click here to get started now.
According to the latest available data from the Bureau of Labor Statistics, American households spend an average of $75,172 per year. These numbers reflect a 21% increase from the average annual household expenditure of $62,188 reported immediately before the outset of the ongoing inflationary period.
While marked increases in consumer prices have raised the cost of living for all Americans, the price of goods and services can vary considerably by geography, and some parts of the country are far more expensive to live in than others.
Using data from the U.S. Department of Commerce, 24/7 Wall St. identified the most expensive U.S. counties to live in. The counties, including county equivalents and independent cities, on this list were selected using the latest available data on regional price parity, or RPP, a cost of living index. Supplemental data on median household income, median home value, and unemployment are five-year estimates from the U.S. Census Bureau’s 2023 American Community Survey.
Among the 50 counties and independent cities on this list, goods and services are anywhere from 11.6% to 32.6% higher than they are nationwide, on average. These counties are largely concentrated in coastal states. California alone is home to 15 counties on this list, and another 12 are located in either New Jersey or New York. (Here is a look at the most expensive states to live in.)
Higher costs in these places are often due to several closely related economic factors, including the fact that the vast majority of these counties are part of a major metropolitan area. In many U.S. cities, land is scarce and housing supply is relatively limited. These same places are also often major population centers where demand for housing is high. This interplay between supply and demand ultimately drives the price of housing up, and housing costs are a key component of the cost of living in any community. Among the counties on this list, median home values are anywhere from about 20% to over 300% higher than the national median. (Here is a look at the states where home prices are still going up.)
Most counties on this list are also home to high-income populations. Nationwide, the typical American household earns $77,719 per year. Meanwhile, in a majority of the most expensive counties, a typical household earns over $100,000 annually. Not only does a higher cost of living make some of these places prohibitively expensive for many lower-income Americans, but high incomes themselves also reinforce higher consumer prices. Generally, in high-income areas where residents have more disposable income, greater consumer spending increases competition for goods and services, which in turn pushes prices higher.
These are the most expensive U.S. counties to live in.
Why It Matters

For years, the rapidly rising prices have been straining household budgets for millions of Americans. While no corner of the country was spared from the effects of inflation, there are specific places where long-standing, deeply entrenched supply and demand dynamics have pushed the cost of living well above what most Americans are accustomed to. In dozens of counties across the United States, the cost of living is over 10% higher than it is nationwide, on average.
50. Newport County, Rhode Island
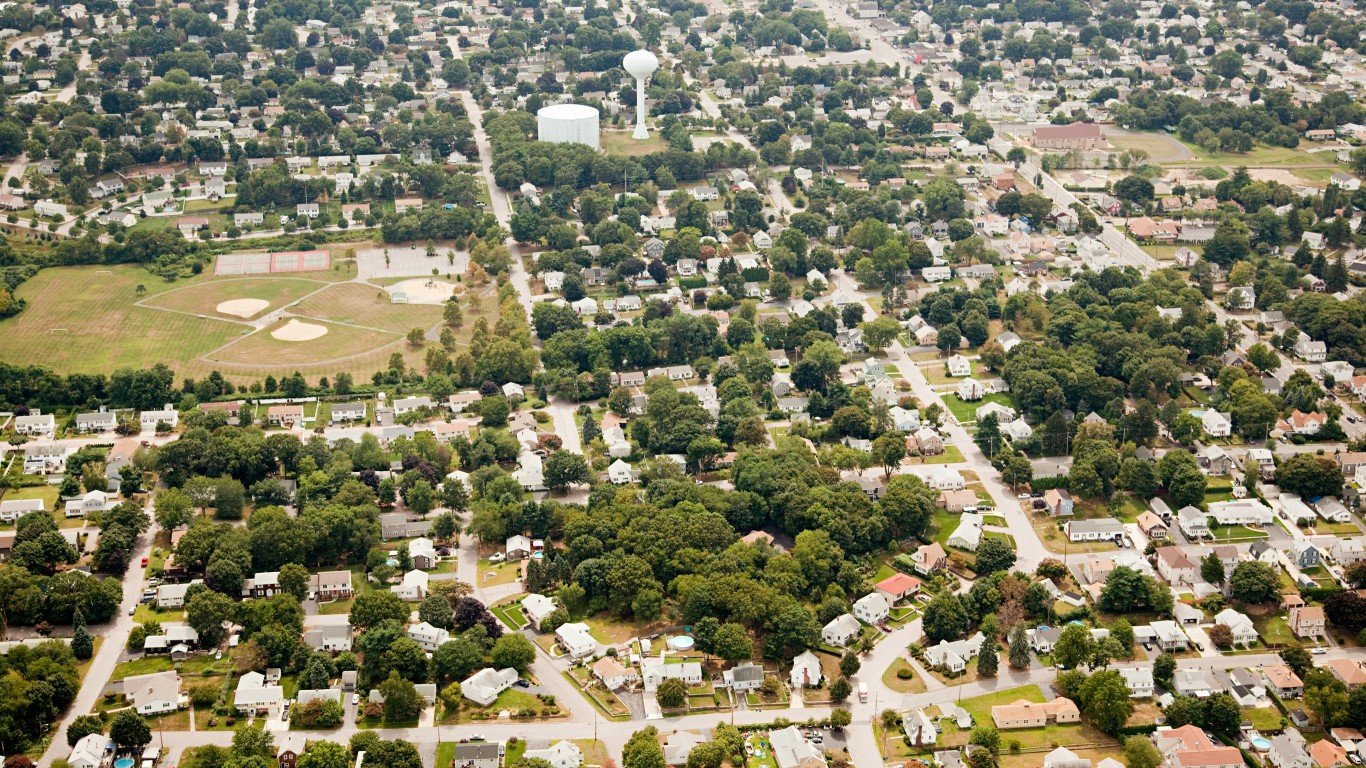
- Estimated cost of living in county: 11.6% higher than national average
- Median household income in county: $100,859 (29.8% higher than national median)
- Median home value in county: $559,700 (64.5% higher than national median)
- 5-year average unemployment rate in county: 6.3% (1.1 ppt. higher than national average)
- County population: 85,095
49. Santa Barbara County, California

- Estimated cost of living in county: 11.8% higher than national average
- Median household income in county: $95,977 (23.5% higher than national median)
- Median home value in county: $735,700 (116.3% higher than national median)
- 5-year average unemployment rate in county: 6.1% (0.9 ppt. higher than national average)
- County population: 443,975
48. Santa Clara County, California

- Estimated cost of living in county: 12.0% higher than national average
- Median household income in county: $159,674 (105.5% higher than national median)
- Median home value in county: $1,382,800 (306.5% higher than national median)
- 5-year average unemployment rate in county: 4.5% (0.7 ppt. lower than national average)
- County population: 1,903,297
47. El Dorado County, California

- Estimated cost of living in county: 12.0% higher than national average
- Median household income in county: $106,190 (36.6% higher than national median)
- Median home value in county: $640,500 (88.3% higher than national median)
- 5-year average unemployment rate in county: 4.8% (0.4 ppt. lower than national average)
- County population: 192,299
46. Los Angeles County, California

- Estimated cost of living in county: 12.1% higher than national average
- Median household income in county: $87,760 (12.9% higher than national median)
- Median home value in county: $783,300 (130.2% higher than national median)
- 5-year average unemployment rate in county: 7.0% (1.8 ppt. higher than national average)
- County population: 9,848,406
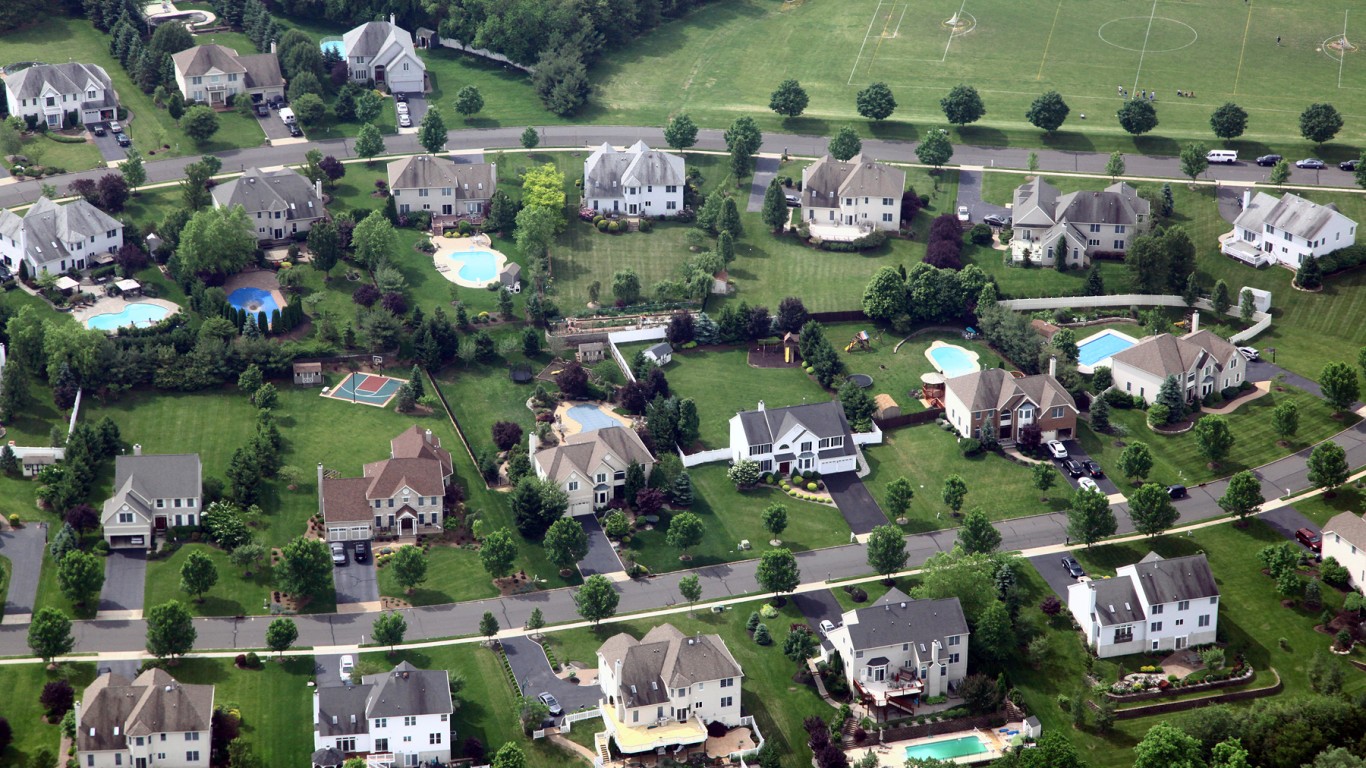
45. Monmouth County, New Jersey

- Estimated cost of living in county: 12.1% higher than national average
- Median household income in county: $122,727 (57.9% higher than national median)
- Median home value in county: $566,500 (66.5% higher than national median)
- 5-year average unemployment rate in county: 5.2% (in-line with national average)
- County population: 643,615
44. Broomfield County, Colorado
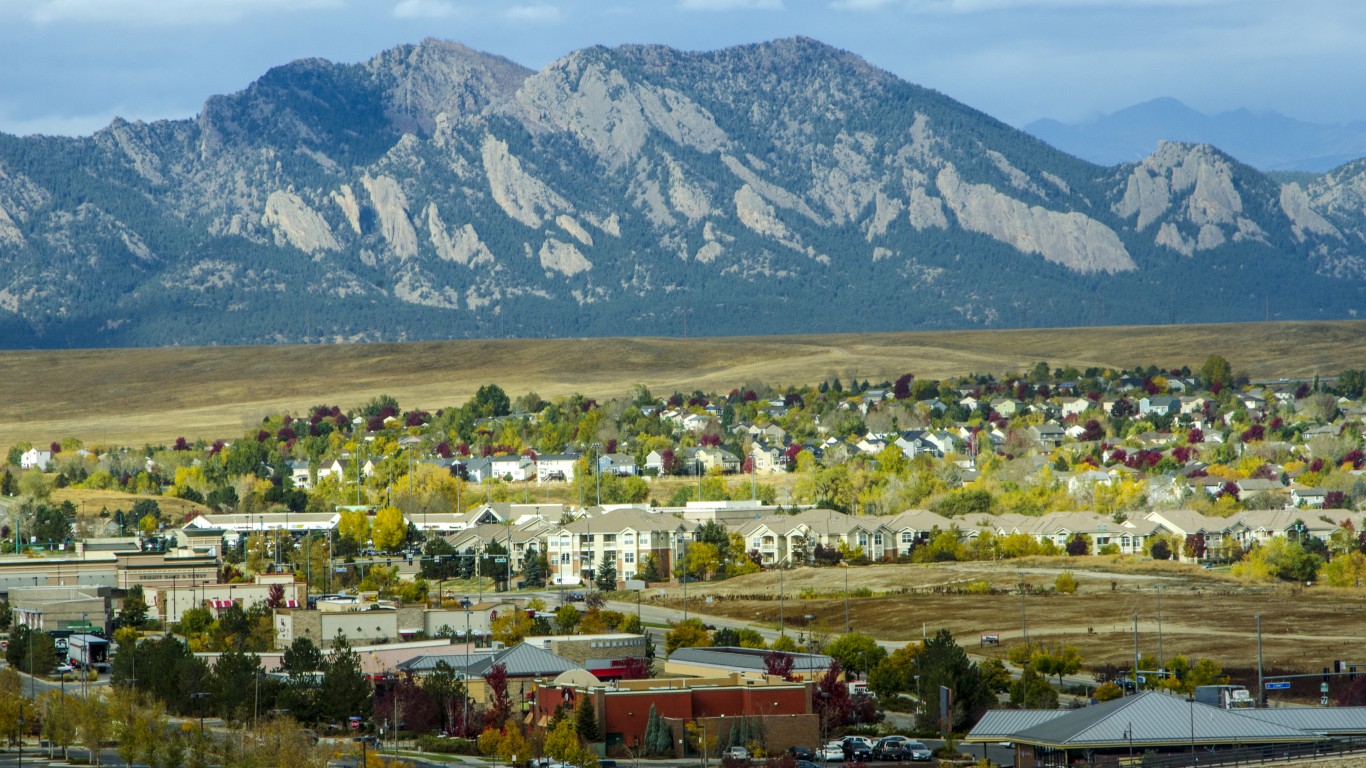
- Estimated cost of living in county: 12.3% higher than national average
- Median household income in county: $121,025 (55.7% higher than national median)
- Median home value in county: $631,600 (85.7% higher than national median)
- 5-year average unemployment rate in county: 3.3% (1.9 ppt. lower than national average)
- County population: 75,110
43. Suffolk County, Massachusetts

- Estimated cost of living in county: 12.3% higher than national average
- Median household income in county: $92,859 (19.5% higher than national median)
- Median home value in county: $680,700 (100.1% higher than national median)
- 5-year average unemployment rate in county: 6.2% (1.0 ppt. higher than national average)
- County population: 782,172
42. Snohomish County, Washington

- Estimated cost of living in county: 12.4% higher than national average
- Median household income in county: $107,982 (38.9% higher than national median)
- Median home value in county: $644,600 (89.5% higher than national median)
- 5-year average unemployment rate in county: 4.4% (0.8 ppt. lower than national average)
- County population: 834,648
41. Nevada County, California

- Estimated cost of living in county: 12.4% higher than national average
- Median household income in county: $84,905 (9.2% higher than national median)
- Median home value in county: $602,800 (77.2% higher than national median)
- 5-year average unemployment rate in county: 4.7% (0.5 ppt. lower than national average)
- County population: 102,452
40. Napa County, California

- Estimated cost of living in county: 12.5% higher than national average
- Median household income in county: $108,970 (40.2% higher than national median)
- Median home value in county: $838,800 (146.6% higher than national median)
- 5-year average unemployment rate in county: 5.1% (0.1 ppt. lower than national average)
- County population: 136,070
39. Middlesex County, Massachusetts

- Estimated cost of living in county: 12.5% higher than national average
- Median household income in county: $126,779 (63.1% higher than national median)
- Median home value in county: $687,200 (102.0% higher than national median)
- 5-year average unemployment rate in county: 4.2% (1.0 ppt. lower than national average)
- County population: 1,622,896
38. Richmond County, New York

- Estimated cost of living in county: 12.6% higher than national average
- Median household income in county: $98,290 (26.5% higher than national median)
- Median home value in county: $658,500 (93.6% higher than national median)
- 5-year average unemployment rate in county: 5.5% (0.3 ppt. higher than national average)
- County population: 492,734
37. Somerset County, New Jersey
- Estimated cost of living in county: 12.6% higher than national average
- Median household income in county: $135,960 (74.9% higher than national median)
- Median home value in county: $523,900 (54.0% higher than national median)
- 5-year average unemployment rate in county: 4.8% (0.4 ppt. lower than national average)
- County population: 346,203
36. District of Columbia, District of Columbia

- Estimated cost of living in county: 12.7% higher than national average
- Median household income in county: $106,287 (36.8% higher than national median)
- Median home value in county: $724,600 (113.0% higher than national median)
- 5-year average unemployment rate in county: 6.5% (1.3 ppt. higher than national average)
- County population: 672,079
35. Howard County, Maryland

- Estimated cost of living in county: 13.2% higher than national average
- Median household income in county: $146,982 (89.1% higher than national median)
- Median home value in county: $576,700 (69.5% higher than national median)
- 5-year average unemployment rate in county: 3.6% (1.6 ppt. lower than national average)
- County population: 333,916
34. Placer County, California

- Estimated cost of living in county: 13.6% higher than national average
- Median household income in county: $114,678 (47.6% higher than national median)
- Median home value in county: $658,800 (93.7% higher than national median)
- 5-year average unemployment rate in county: 4.5% (0.7 ppt. lower than national average)
- County population: 412,435
33. Norfolk County, Massachusetts

- Estimated cost of living in county: 13.6% higher than national average
- Median household income in county: $126,497 (62.8% higher than national median)
- Median home value in county: $649,400 (90.9% higher than national median)
- 5-year average unemployment rate in county: 4.9% (0.3 ppt. lower than national average)
- County population: 724,540
32. Bergen County, New Jersey

- Estimated cost of living in county: 13.7% higher than national average
- Median household income in county: $123,715 (59.2% higher than national median)
- Median home value in county: $593,200 (74.4% higher than national median)
- 5-year average unemployment rate in county: 5.5% (0.3 ppt. higher than national average)
- County population: 954,717
31. Honolulu County, Hawaii

- Estimated cost of living in county: 14.0% higher than national average
- Median household income in county: $104,264 (34.2% higher than national median)
- Median home value in county: $873,000 (156.6% higher than national median)
- 5-year average unemployment rate in county: 4.8% (0.4 ppt. lower than national average)
- County population: 1,003,666
30. Summit County, Colorado

- Estimated cost of living in county: 14.1% higher than national average
- Median household income in county: $106,255 (36.7% higher than national median)
- Median home value in county: $850,700 (150.1% higher than national median)
- 5-year average unemployment rate in county: 3.3% (1.9 ppt. lower than national average)
- County population: 30,857
29. Montgomery County, Maryland

- Estimated cost of living in county: 14.3% higher than national average
- Median household income in county: $128,733 (65.6% higher than national median)
- Median home value in county: $615,200 (80.8% higher than national median)
- 5-year average unemployment rate in county: 4.8% (0.4 ppt. lower than national average)
- County population: 1,057,586
28. Contra Costa County, California

- Estimated cost of living in county: 15.0% higher than national average
- Median household income in county: $125,727 (61.8% higher than national median)
- Median home value in county: $830,800 (144.2% higher than national median)
- 5-year average unemployment rate in county: 5.9% (0.7 ppt. higher than national average)
- County population: 1,161,458
27. San Diego County, California
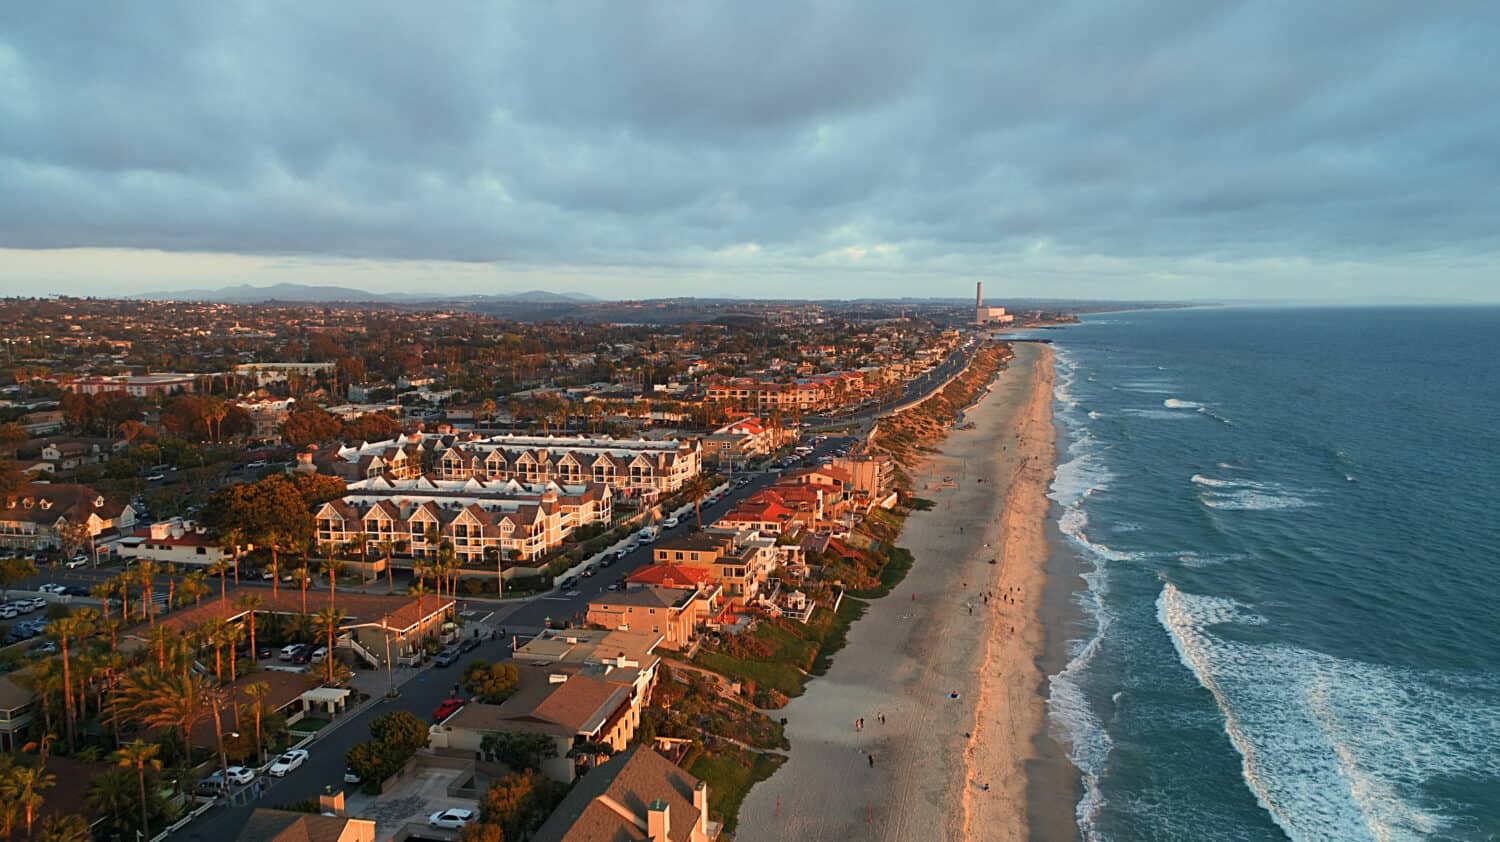
- Estimated cost of living in county: 15.1% higher than national average
- Median household income in county: $102,285 (31.6% higher than national median)
- Median home value in county: $791,600 (132.7% higher than national median)
- 5-year average unemployment rate in county: 6.2% (1.0 ppt. higher than national average)
- County population: 3,282,782
26. Loudoun County, Virginia
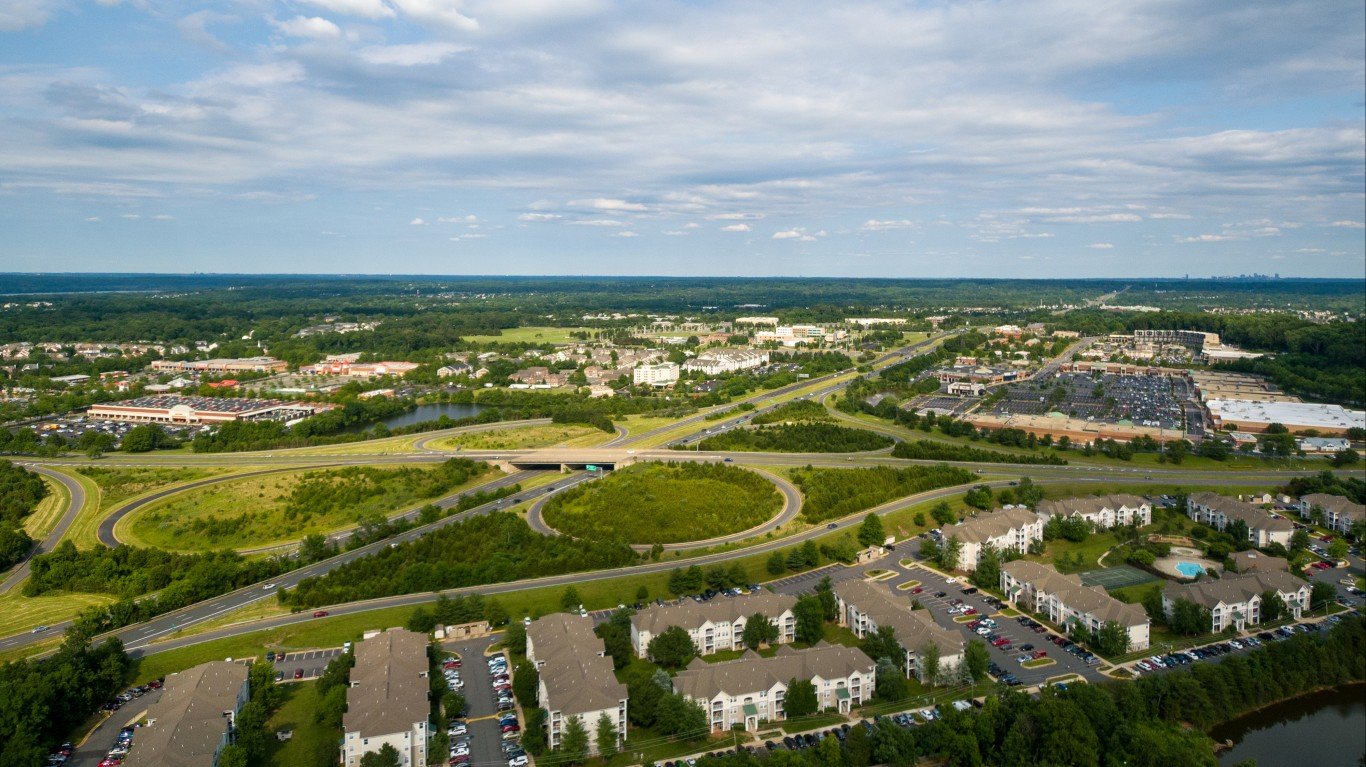
- Estimated cost of living in county: 15.2% higher than national average
- Median household income in county: $178,707 (129.9% higher than national median)
- Median home value in county: $701,000 (106.1% higher than national median)
- 5-year average unemployment rate in county: 3.2% (2.0 ppt. lower than national average)
- County population: 427,082
25. Queens County, New York
- Estimated cost of living in county: 15.4% higher than national average
- Median household income in county: $84,961 (9.3% higher than national median)
- Median home value in county: $699,200 (105.5% higher than national median)
- 5-year average unemployment rate in county: 7.0% (1.8 ppt. higher than national average)
- County population: 2,330,124
24. Morris County, New Jersey

- Estimated cost of living in county: 15.6% higher than national average
- Median household income in county: $134,929 (73.6% higher than national median)
- Median home value in county: $557,000 (63.7% higher than national median)
- 5-year average unemployment rate in county: 5.2% (in-line with national average)
- County population: 510,375
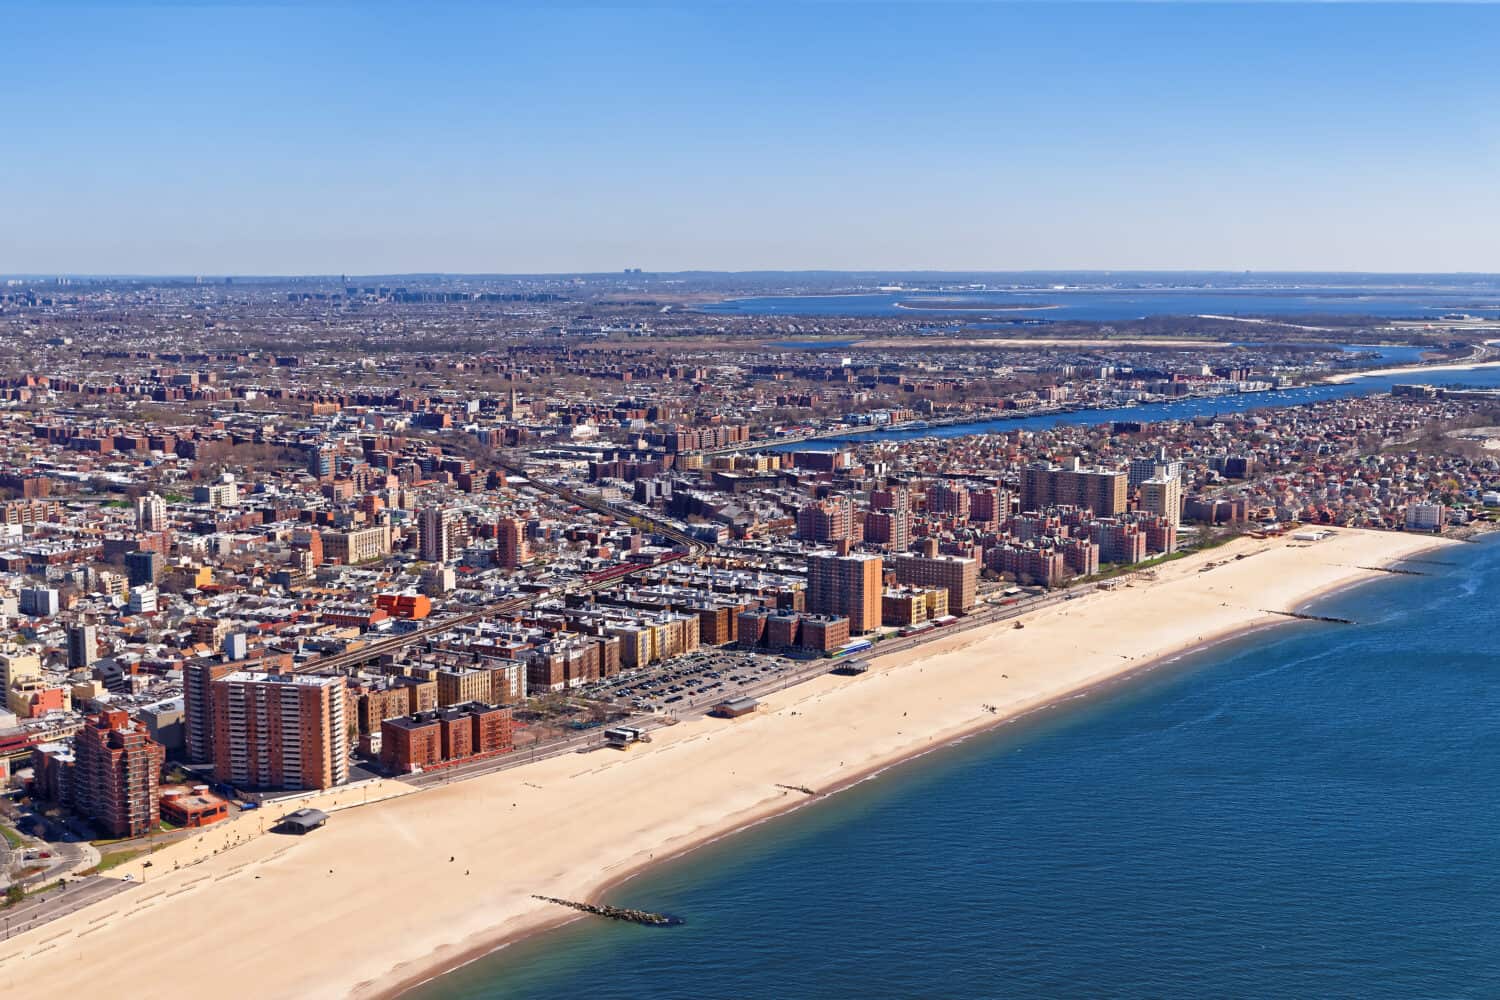
23. Kings County, New York

- Estimated cost of living in county: 15.9% higher than national average
- Median household income in county: $78,548 (1.1% higher than national median)
- Median home value in county: $889,700 (161.5% higher than national median)
- 5-year average unemployment rate in county: 7.5% (2.3 ppt. higher than national average)
- County population: 2,646,306
22. Fairfax, Virginia (independent city)

- Estimated cost of living in city: 15.9% higher than national average
- Median household income in city: $132,774 (70.8% higher than national median)
- Median home value in city: $677,400 (99.1% higher than national median)
- 5-year average unemployment rate in city: 4.5% (0.7 ppt. lower than national average)
- City population: 24,478
21. Douglas County, Colorado

- Estimated cost of living in county: 16.2% higher than national average
- Median household income in county: $145,737 (87.5% higher than national median)
- Median home value in county: $674,000 (98.1% higher than national median)
- 5-year average unemployment rate in county: 3.6% (1.6 ppt. lower than national average)
- County population: 368,283
20. Westchester County, New York

- Estimated cost of living in county: 16.7% higher than national average
- Median household income in county: $118,411 (52.4% higher than national median)
- Median home value in county: $638,400 (87.7% higher than national median)
- 5-year average unemployment rate in county: 6.0% (0.8 ppt. higher than national average)
- County population: 996,888
19. Putnam County, New York

- Estimated cost of living in county: 17.0% higher than national average
- Median household income in county: $127,405 (63.9% higher than national median)
- Median home value in county: $448,000 (31.7% higher than national median)
- 5-year average unemployment rate in county: 4.1% (1.1 ppt. lower than national average)
- County population: 97,988
18. Alameda County, California

- Estimated cost of living in county: 17.1% higher than national average
- Median household income in county: $126,240 (62.4% higher than national median)
- Median home value in county: $1,057,400 (210.8% higher than national median)
- 5-year average unemployment rate in county: 5.2% (in-line with national average)
- County population: 1,651,949
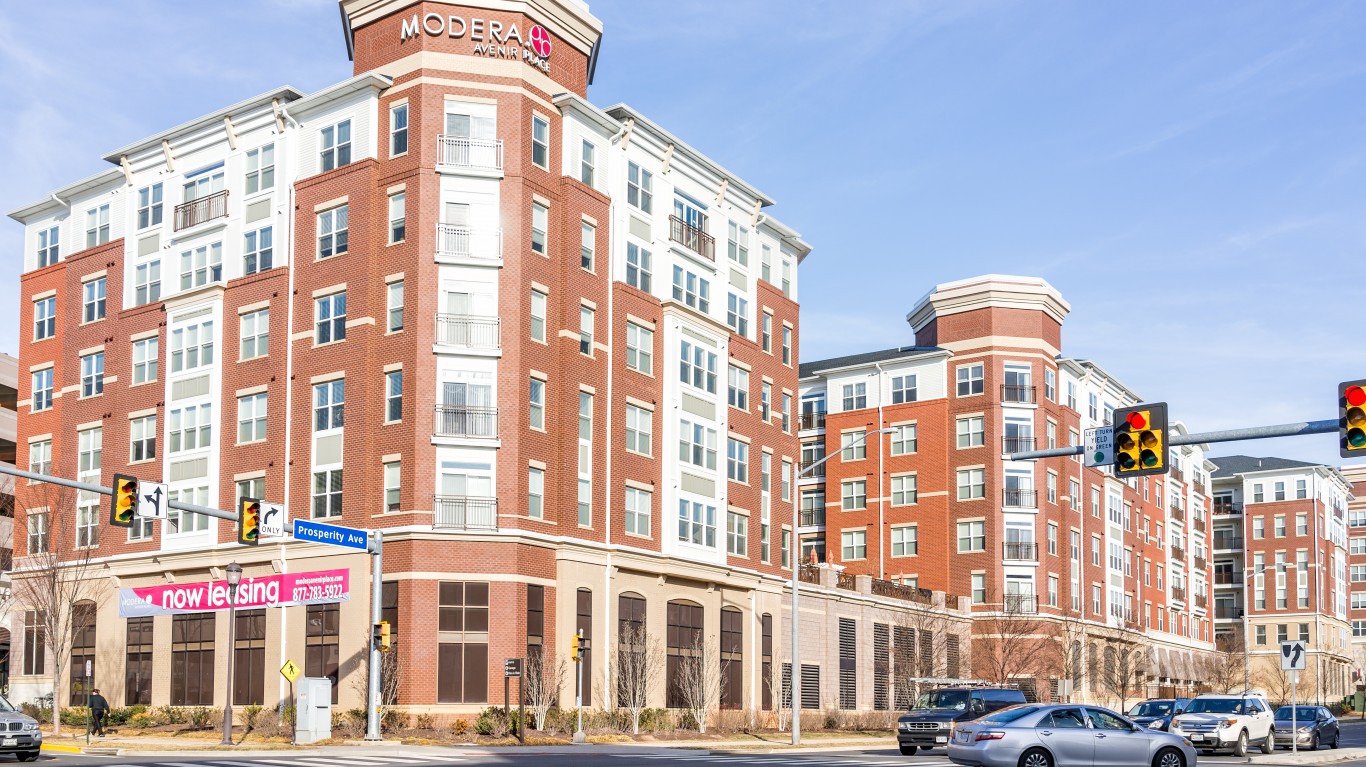
17. Fairfax County, Virginia

- Estimated cost of living in county: 17.5% higher than national average
- Median household income in county: $150,113 (93.1% higher than national median)
- Median home value in county: $699,700 (105.7% higher than national median)
- 5-year average unemployment rate in county: 4.0% (1.2 ppt. lower than national average)
- County population: 1,144,474
16. Kalawao County, Hawaii

- Estimated cost of living in county: 17.5% higher than national average
- Median household income in county: $86,250 (11.0% higher than national median)
- Median home value in county: N/A
- 5-year average unemployment rate in county: N/A
- County population: 43
15. King County, Washington

- Estimated cost of living in county: 17.8% higher than national average
- Median household income in county: $122,148 (57.2% higher than national median)
- Median home value in county: $811,200 (138.4% higher than national median)
- 5-year average unemployment rate in county: 4.6% (0.6 ppt. lower than national average)
- County population: 2,262,713
14. Suffolk County, New York

- Estimated cost of living in county: 18.1% higher than national average
- Median household income in county: $128,329 (65.1% higher than national median)
- Median home value in county: $539,500 (58.6% higher than national median)
- 5-year average unemployment rate in county: 4.6% (0.6 ppt. lower than national average)
- County population: 1,525,680
13. Alpine County, California

- Estimated cost of living in county: 18.8% higher than national average
- Median household income in county: $110,781 (42.5% higher than national median)
- Median home value in county: $466,100 (37.0% higher than national median)
- 5-year average unemployment rate in county: 3.6% (1.6 ppt. lower than national average)
- County population: 1,695
12. Monroe County, Florida

- Estimated cost of living in county: 18.9% higher than national average
- Median household income in county: $82,430 (6.1% higher than national median)
- Median home value in county: $723,800 (112.8% higher than national median)
- 5-year average unemployment rate in county: 3.2% (2.0 ppt. lower than national average)
- County population: 81,840
11. Alexandria Virginia (independent city)

- Estimated cost of living in city: 19.9% higher than national average
- Median household income in city: $113,638 (46.2% higher than national median)
- Median home value in city: $696,800 (104.8% higher than national median)
- 5-year average unemployment rate in city: 3.4% (1.8 ppt. lower than national average)
- City population: 156,788
10. Falls Church, Virginia (independent city)
- Estimated cost of living in city: 20.2% higher than national average
- Median household income in city: $154,734 (99.1% higher than national median)
- Median home value in city: $1,005,400 (195.5% higher than national median)
- 5-year average unemployment rate in city: 6.3% (1.1 ppt. higher than national average)
- City population: 14,593
9. Orange County, California

- Estimated cost of living in county: 20.3% higher than national average
- Median household income in county: $113,702 (46.3% higher than national median)
- Median home value in county: $915,500 (169.1% higher than national median)
- 5-year average unemployment rate in county: 5.3% (0.1 ppt. higher than national average)
- County population: 3,164,063
8. Nassau County, New York

- Estimated cost of living in county: 20.6% higher than national average
- Median household income in county: $143,408 (84.5% higher than national median)
- Median home value in county: $658,700 (93.6% higher than national median)
- 5-year average unemployment rate in county: 4.8% (0.4 ppt. lower than national average)
- County population: 1,388,138
7. Crook County, Oregon

- Estimated cost of living in county: 22.6% higher than national average
- Median household income in county: $81,675 (5.1% higher than national median)
- Median home value in county: $423,300 (24.4% higher than national median)
- 5-year average unemployment rate in county: 5.3% (0.1 ppt. higher than national average)
- County population: 25,651
6. San Francisco County, California

- Estimated cost of living in county: 23.3% higher than national average
- Median household income in county: $141,446 (82.0% higher than national median)
- Median home value in county: $1,380,500 (305.8% higher than national median)
- 5-year average unemployment rate in county: 5.6% (0.4 ppt. higher than national average)
- County population: 836,321
5. Arlington County, Virginia

- Estimated cost of living in county: 25.2% higher than national average
- Median household income in county: $140,160 (80.3% higher than national median)
- Median home value in county: $864,800 (154.2% higher than national median)
- 5-year average unemployment rate in county: 3.3% (1.9 ppt. lower than national average)
- County population: 235,463
4. Marin County, California

- Estimated cost of living in county: 27.2% higher than national average
- Median household income in county: $142,785 (83.7% higher than national median)
- Median home value in county: $1,390,000 (308.6% higher than national median)
- 5-year average unemployment rate in county: 6.1% (0.9 ppt. higher than national average)
- County population: 258,765
3. San Mateo County, California

- Estimated cost of living in county: 27.7% higher than national average
- Median household income in county: $156,000 (100.7% higher than national median)
- Median home value in county: $1,494,500 (339.3% higher than national median)
- 5-year average unemployment rate in county: 4.5% (0.7 ppt. lower than national average)
- County population: 745,100
2. Leelanau County, Michigan

- Estimated cost of living in county: 30.9% higher than national average
- Median household income in county: $91,943 (18.3% higher than national median)
- Median home value in county: $406,900 (19.6% higher than national median)
- 5-year average unemployment rate in county: 3.9% (1.3 ppt. lower than national average)
- County population: 22,607
1. New York County, New York

- Estimated cost of living in county: 32.6% higher than national average
- Median household income in county: $104,553 (34.5% higher than national median)
- Median home value in county: $1,108,900 (226.0% higher than national median)
- 5-year average unemployment rate in county: 7.0% (1.8 ppt. higher than national average)
- County population: 1,627,788
The post $75K+ a Year Just to Get By: The Most Expensive U.S. Counties Ranked appeared first on 24/7 Wall St..