


These US Housing Markets Are on Fire
The housing market has leveled off over the past year, showing only modest growth. There was only about a 0.8% rise in median home price when comparing May 2025 to May 2024. However, this is not the case for new home prices, which have fallen 7.5% year-over-year. They now sit at about $403,600. Notably, we […] The post These US Housing Markets Are on Fire appeared first on 24/7 Wall St..

The housing market has leveled off over the past year, showing only modest growth. There was only about a 0.8% rise in median home price when comparing May 2025 to May 2024. However, this is not the case for new home prices, which have fallen 7.5% year-over-year. They now sit at about $403,600.
Notably, we have seen a steep rise in inventory, with roughly 34% more sellers than buyers, placing the power in the hands of the buyer. Despite this large gap, economists predict that the market will balance out sometime this year, with slight price growth of between 2-4%.
Using data from Realtor.com, 24/7 Wall St. identified America’s 30 hottest housing markets. Metro areas are ranked by their Market Hotness Index score, a proprietary measure from Realtor.com that takes into account how long homes are on the market and several measures of supply and demand dynamics. All data is for April 2025. When two metro areas have the same index score, the city where the median list price has climbed more in the last year ranks higher.
This post was updated on June 12, 2025 to reflect up-to-date information on the housing market.
Why Are We Writing About the US Housing Market?

An increase in housing demand and prices impacts economic growth through spending on construction, notably having a major impact on employment numbers. Economists often look to the number of new home builds to determine American household wealth and sensitivity to interest rate changes.
These are the hottest housing markets in America:
30. Allentown-Bethlehem, PA-NJ
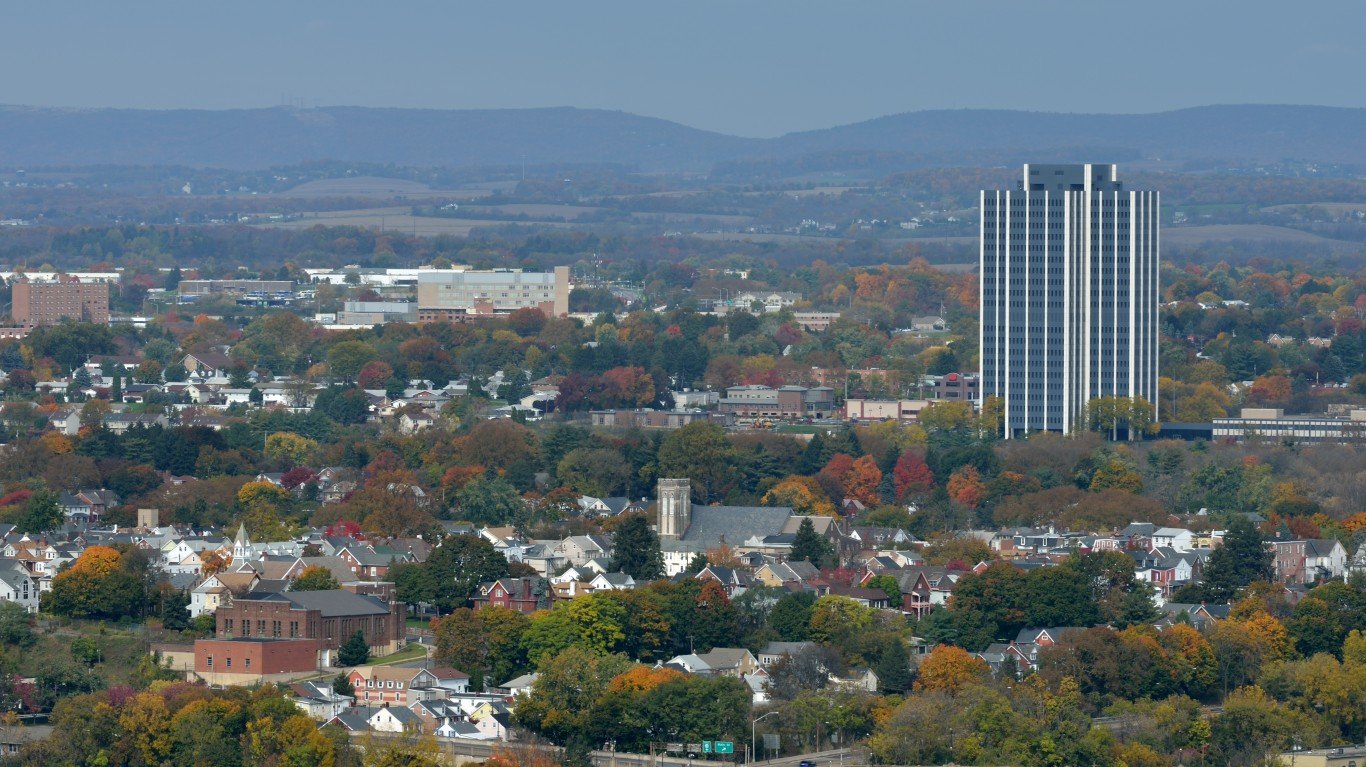
- Hotness Index Score (April 2025): 86.29 out of 100
- Median Days on the Market: 31
29. Harrisburg-Carlisle, PA

- Hotness Index Score (April 2025): 86.45 out of 100
- Median Days on the Market: 30.5
28. Wausau, WI

- Hotness Index Score (April 2025): 87.12 out of 100
- Median Days on the Market: 36.5
27. Akron, OH

- Hotness Index Score (April 2025): 88.46 out of 100
- Median Days on the Market: 33
26. York-Hanover, PA

- Hotness Index Score (April 2025): 88.46 out of 100
- Median Days on the Market: 29
24. Canton-Massillon, OH (tied)
- Hotness Index Score (April 2025): 88.80 out of 100
- Median Days on the Market: 30
24. Boston-Cambridge-Newton, MA-NH (tied)

- Hotness Index Score (April 2025): 88.80 out of 100
- Median Days on the Market: 24.5
23. Racine, WI

- Hotness Index Score (April 2025): 88.96 out of 100
- Median Days on the Market: 31.5
22. Rockford, IL

- Hotness Index Score (April 2025): 88.96 out of 100
- Median Days on the Market: 34.5
21. Binghamton, NY

- Hotness Index Score (April 2025): 88.96 out of 100
- Median Days on the Market: 35.75
18. New Haven-Milford, CT (tied)

- Hotness Index Score (April 2025): 89.46 out of 100
- Median Days on the Market: 35.5
18. Milwaukee-Waukesha-West Allis, WI (tied)

- Hotness Index Score (April 2025): 89.46 out of 100
- Median Days on the Market: 29.5
16. Springfield, IL (tied)

- Hotness Index Score (April 2025): 89.80 out of 100
- Median Days on the Market: 32.5
16. Bloomington, IL (tied)

- Hotness Index Score (April 2025): 89.80 out of 100
- Median Days on the Market: 31
15. Columbus, OH

- Hotness Index Score (April 2025): 90.47 out of 100
- Median Days on the Market: 31
14. Providence-Warwick, RI-MA

- Hotness Index Score (April 2025): 92.31 out of 100
- Median Days on the Market: 29
13. Reading, PA

- Hotness Index Score (April 2025): 92.81 out of 100
- Median Days on the Market: 22.5
12. Norwich-New London, CT

- Hotness Index Score (April 2025): 93.31 out of 100
- Median Days on the Market: 30.5
11. Lancaster, PA

- Hotness Index Score (April 2025): 93.65 out of 100
- Median Days on the Market: 26.5
10. Oshkosh-Neenah, WI

- Hotness Index Score (April 2025): 93.81 out of 100
- Median Days on the Market: 31.5
9. Bridgeport-Stamford-Norwalk, CT

- Hotness Index Score (April 2025): 95.15 out of 100
- Median Days on the Market: 28.5
8. Concord, NH

- Hotness Index Score (April 2025): 95.48 out of 100
- Median Days on the Market: 30
7. Rochester, NY

- Hotness Index Score (April 2025): 96.32 out of 100
- Median Days on the Market: 27
6. Worcester, MA-CT

- Hotness Index Score (April 2025): 96.66 out of 100
- Median Days on the Market: 20.5
4. Hartford-West Hartford, CT

- Hotness Index Score (April 2025): 96.99 out of 100
- Median Days on the Market: 29.5
1. Springfield, MA (tied)

- Hotness Index Score (April 2025): 99.33 out of 100
- Median Days on the Market: 23
1. Manchester-Nashua, NH (tied)

- Hotness Index Score (April 2025): 99.33 out of 100
- Median Days on the Market: 23.5
The post These US Housing Markets Are on Fire appeared first on 24/7 Wall St..