


These Communities Have Waved Goodbye to The American Dream
The American dream, and all it stands for, is inseparable from the great nation of the United States. For decades and multiple generations, families have moved from foreign countries seeking a better way of life. The American dream dictates that it doesn’t matter where you came from or how much you have struggled; if you […] The post These Communities Have Waved Goodbye to The American Dream appeared first on 24/7 Wall St..
The American dream, and all it stands for, is inseparable from the great nation of the United States. For decades and multiple generations, families have moved from foreign countries seeking a better way of life. The American dream dictates that it doesn’t matter where you came from or how much you have struggled; if you are willing to work hard, you can better your circumstances for yourself and your family. It also prioritizes values of freedom to do what one chooses, without being boxed in by prior circumstances.
After WWII, the economy was booming, leading to excellent economic circumstances in the following years. Opportunities for upward mobility abounded! In fact, when adjusted for inflation, 90% of individuals who grew up in the 60s earned a higher salary as adults than their parents did. Two decades later, statistics had changed, with only 50% of people coming up in the 1980s earning more money as adults than their parents earned. This downward trend only continues today.
These changing socioeconomic conditions in a country once highly regarded for its American dream are largely due to a widening wealth inequality. As the gap between our nation’s most wealthy and poorest residents grows larger, concerns over wealth concentrations also grow. In our current society, it is not easy to rise from poverty or even the middle-class into a higher income range. Low income and middle-class Americans have seen their wages stagnate, while only the wealthiest Americans accrue more wealth.
Using data from Opportunity Insights, 24/7 Wall St. identified the counties where the American Dream is dead. We reviewed data at the county and county equivalent level on the average household income for Americans born into households in the bottom 25% of the income spectrum in both 1978 and 1992. Counties are ranked on the percent change in inflation-adjusted average household income among each cohort at age 27. A full complete methodological breakdown is available here.
In each of the 49 counties and county equivalents on this list, average household earnings at age 27 have declined by at least 20.5% from those born into low-income households in 1978 compared to those born into low-income households in 1992. In more practical terms, Americans who were born in these places in 1978 earned an average of anywhere from $4,640 to $19,100 more at age 27 than those who were born in 1992.
Unfortunately, as poverty becomes more pervasive, several of the locations on our list are home to residents deep in poverty. According to the U.S. Census Bureau’s five-year estimates, the majority of these counties are way below the national poverty line of 12.5%.
Why It Matters
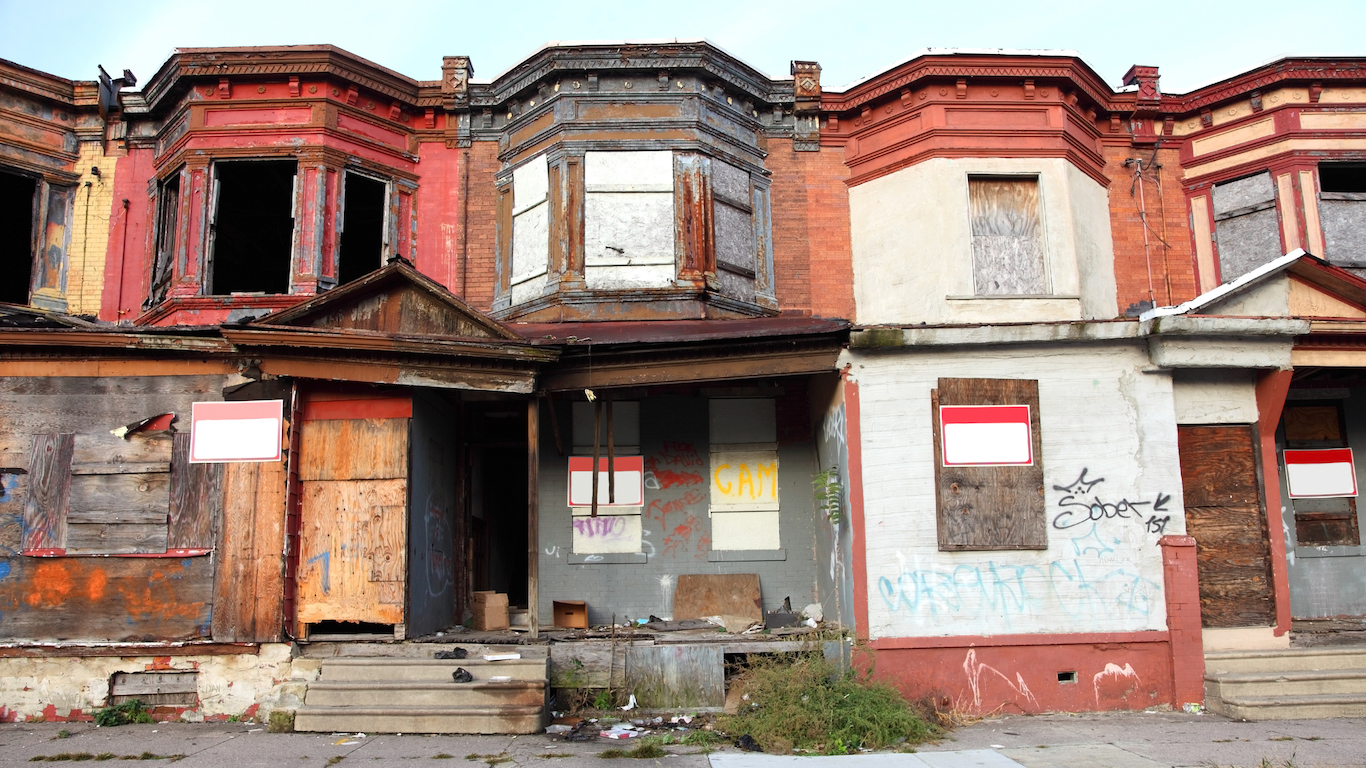
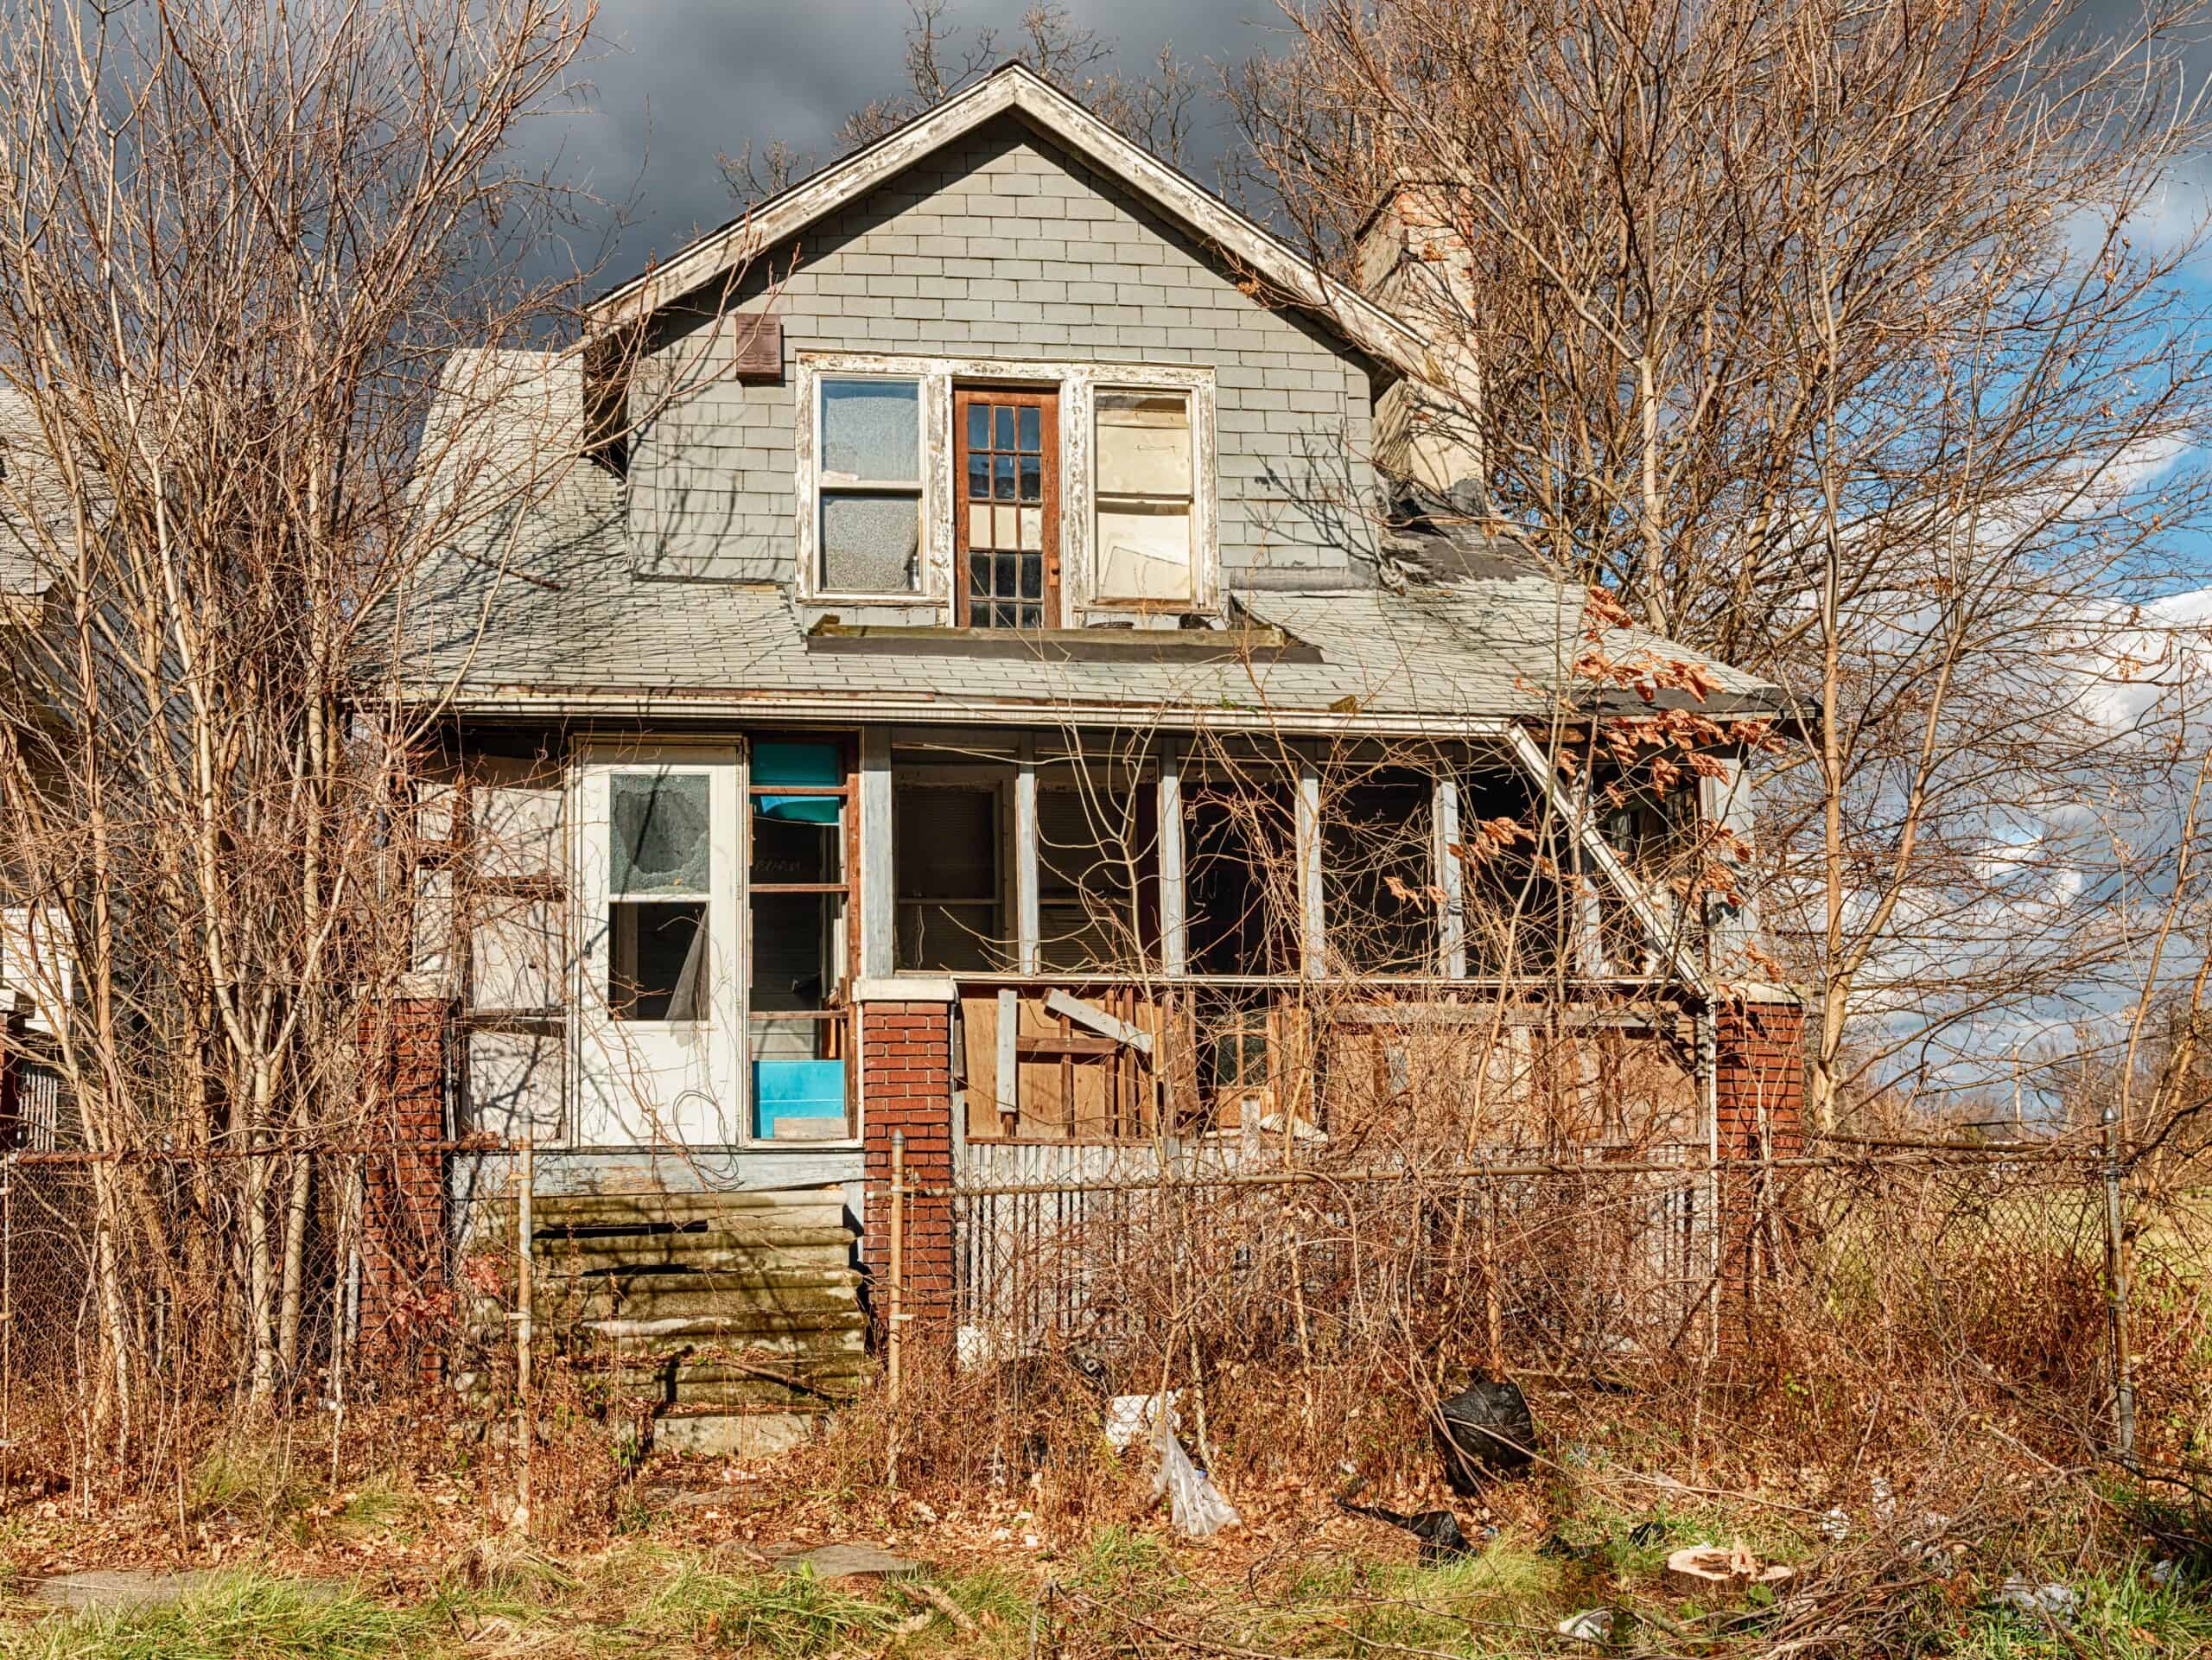
Perhaps the most notable aspect of the United States is its long-cherished ‘American Dream.’ But in today’s America, this dream seems to be a slowly fading mirage. In fact, for the communities on this list, the notion of the American Dream may be laughable. Residents of these communities know better than anyone that our country’s greatest pride, The American Dream, is gone.
49. Union County, Florida
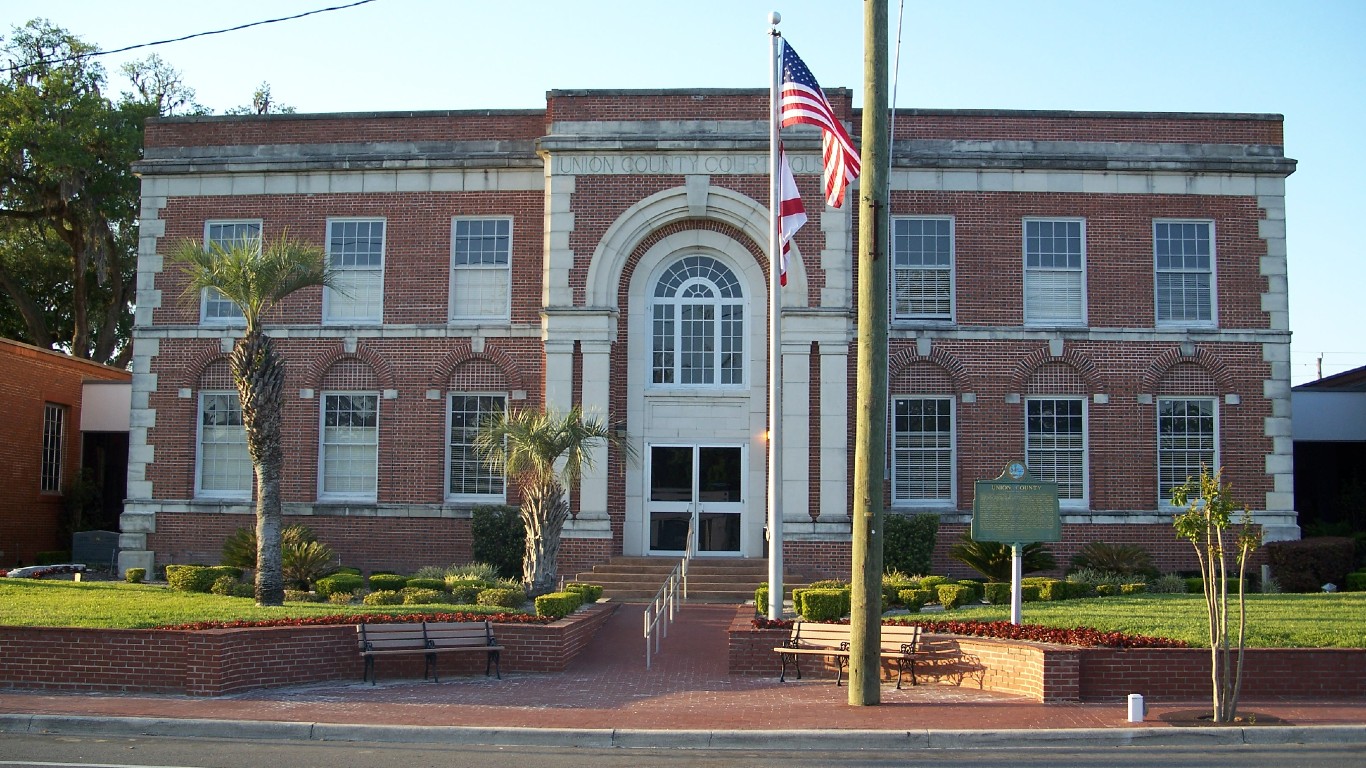
- Long-term change in avg. earnings for 27 year-olds born into low-income households: -20.5% (-$6,778)
- Avg. earnings among 27 year-olds born in 1978 into low-income households: $33,081 (inflation-adjusted)
- Avg. earnings among 27 year-olds born in 1992 into low-income households: $26,303 (inflation-adjusted)
- 2023 unemployment rate: 3.0%
- Homeownership rate in 2022: 69.7%
- Poverty rate in 2022: 15.9%
- Total population: 15,524
48. Baker County, Florida

- Long-term change in avg. earnings for 27 year-olds born into low-income households: -20.5% (-$6,680)
- Avg. earnings among 27 year-olds born in 1978 into low-income households: $32,566 (inflation-adjusted)
- Avg. earnings among 27 year-olds born in 1992 into low-income households: $25,886 (inflation-adjusted)
- 2023 unemployment rate: 2.9%
- Homeownership rate in 2022: 79.8%
- Poverty rate in 2022: 13.7%
- Total population: 27,969
47. Carbon County, Utah
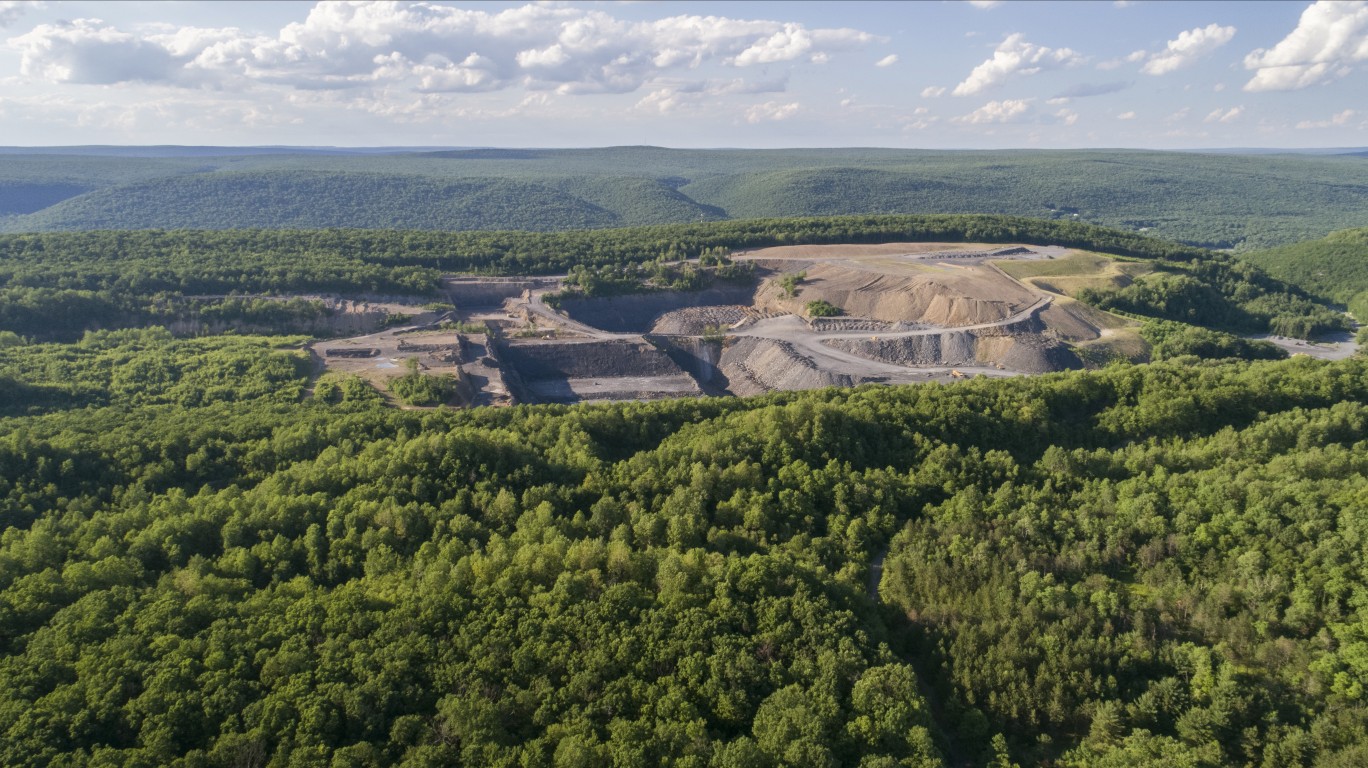
- Long-term change in avg. earnings for 27 year-olds born into low-income households: -20.6% (-$8,152)
- Avg. earnings among 27 year-olds born in 1978 into low-income households: $39,664 (inflation-adjusted)
- Avg. earnings among 27 year-olds born in 1992 into low-income households: $31,512 (inflation-adjusted)
- 2023 unemployment rate: 3.7%
- Homeownership rate in 2022: 67.0%
- Poverty rate in 2022: 16.6%
- Total population: 20,338
46. Campbell County, Wyoming

- Long-term change in avg. earnings for 27 year-olds born into low-income households: -20.6% (-$9,436)
- Avg. earnings among 27 year-olds born in 1978 into low-income households: $45,896 (inflation-adjusted)
- Avg. earnings among 27 year-olds born in 1992 into low-income households: $36,460 (inflation-adjusted)
- 2023 unemployment rate: 2.7%
- Homeownership rate in 2022: 78.3%
- Poverty rate in 2022: 9.5%
- Total population: 46,857
45. Poquoson city, Virginia
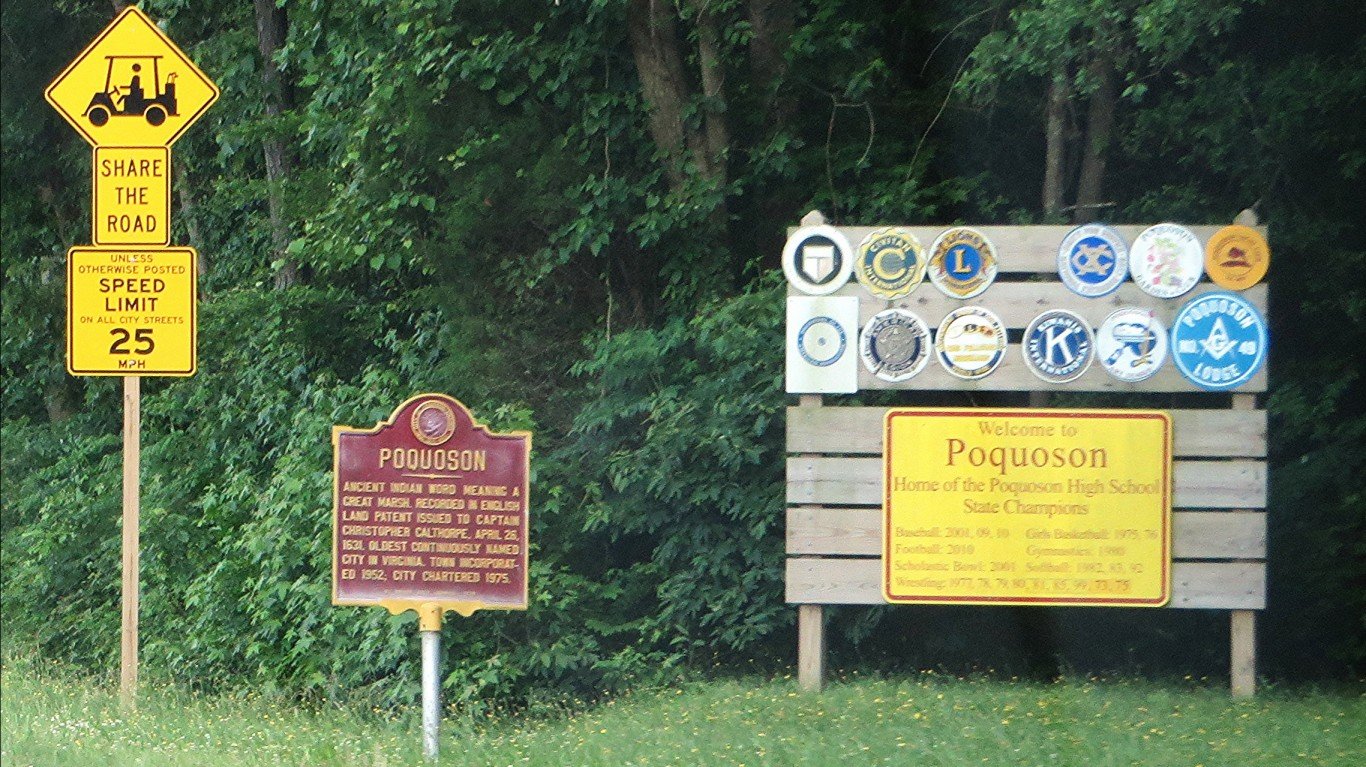
- Long-term change in avg. earnings for 27 year-olds born into low-income households: -20.6% (-$8,029)
- Avg. earnings among 27 year-olds born in 1978 into low-income households: $39,001 (inflation-adjusted)
- Avg. earnings among 27 year-olds born in 1992 into low-income households: $30,972 (inflation-adjusted)
- 2023 unemployment rate: 2.5%
- Homeownership rate in 2022: 82.1%
- Poverty rate in 2022: 4.5%
- Total population: 12,479
44. Northwest Arctic Borough, Alaska
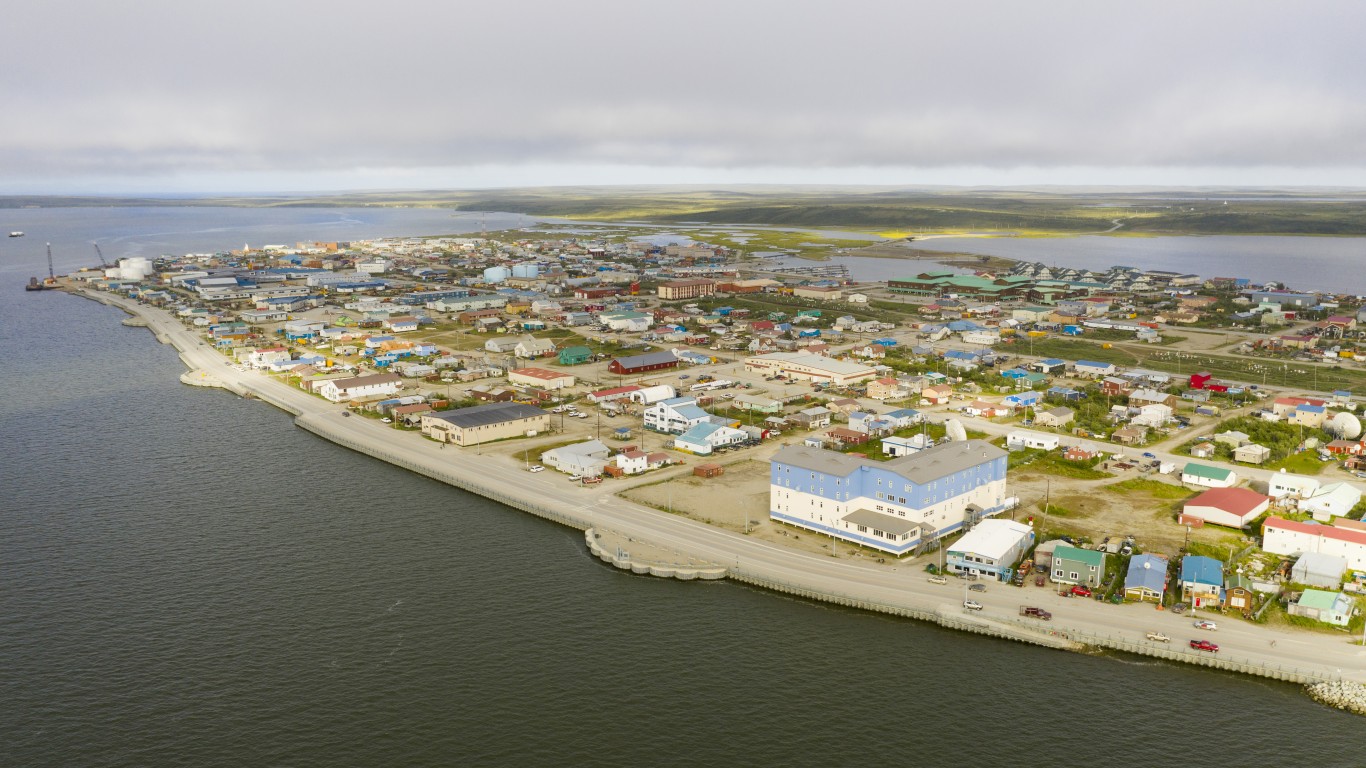
- Long-term change in avg. earnings for 27 year-olds born into low-income households: -20.9% (-$4,637)
- Avg. earnings among 27 year-olds born in 1978 into low-income households: $22,145 (inflation-adjusted)
- Avg. earnings among 27 year-olds born in 1992 into low-income households: $17,509 (inflation-adjusted)
- 2023 unemployment rate: 9.6%
- Homeownership rate in 2022: 61.0%
- Poverty rate in 2022: 18.5%
- Total population: 7,682
43. Hopewell city, Virginia
- Long-term change in avg. earnings for 27 year-olds born into low-income households: -21.0% (-$6,208)
- Avg. earnings among 27 year-olds born in 1978 into low-income households: $29,597 (inflation-adjusted)
- Avg. earnings among 27 year-olds born in 1992 into low-income households: $23,389 (inflation-adjusted)
- 2023 unemployment rate: 4.4%
- Homeownership rate in 2022: 53.6%
- Poverty rate in 2022: 21.3%
- Total population: 23,046
42. Dickenson County, Virginia
- Long-term change in avg. earnings for 27 year-olds born into low-income households: -21.2% (-$8,424)
- Avg. earnings among 27 year-olds born in 1978 into low-income households: $39,661 (inflation-adjusted)
- Avg. earnings among 27 year-olds born in 1992 into low-income households: $31,237 (inflation-adjusted)
- 2023 unemployment rate: 4.4%
- Homeownership rate in 2022: 77.2%
- Poverty rate in 2022: 22.5%
- Total population: 14,089
41. Caldwell Parish, Louisiana
- Long-term change in avg. earnings for 27 year-olds born into low-income households: -21.6% (-$9,132)
- Avg. earnings among 27 year-olds born in 1978 into low-income households: $42,370 (inflation-adjusted)
- Avg. earnings among 27 year-olds born in 1992 into low-income households: $33,237 (inflation-adjusted)
- 2023 unemployment rate: 4.0%
- Homeownership rate in 2022: 69.6%
- Poverty rate in 2022: 24.9%
- Total population: 9,658
40. Pawnee County, Kansas
- Long-term change in avg. earnings for 27 year-olds born into low-income households: -21.7% (-$9,045)
- Avg. earnings among 27 year-olds born in 1978 into low-income households: $41,599 (inflation-adjusted)
- Avg. earnings among 27 year-olds born in 1992 into low-income households: $32,554 (inflation-adjusted)
- 2023 unemployment rate: 2.6%
- Homeownership rate in 2022: 61.7%
- Poverty rate in 2022: 11.9%
- Total population: 6,288
39. Converse County, Wyoming

- Long-term change in avg. earnings for 27 year-olds born into low-income households: -22.3% (-$10,153)
- Avg. earnings among 27 year-olds born in 1978 into low-income households: $45,483 (inflation-adjusted)
- Avg. earnings among 27 year-olds born in 1992 into low-income households: $35,330 (inflation-adjusted)
- 2023 unemployment rate: 2.3%
- Homeownership rate in 2022: 80.5%
- Poverty rate in 2022: 11.0%
- Total population: 13,729
38. Swift County, Minnesota

- Long-term change in avg. earnings for 27 year-olds born into low-income households: -22.5% (-$10,158)
- Avg. earnings among 27 year-olds born in 1978 into low-income households: $45,141 (inflation-adjusted)
- Avg. earnings among 27 year-olds born in 1992 into low-income households: $34,983 (inflation-adjusted)
- 2023 unemployment rate: 3.1%
- Homeownership rate in 2022: 73.7%
- Poverty rate in 2022: 10.7%
- Total population: 9,806
37. Kane County, Utah

- Long-term change in avg. earnings for 27 year-olds born into low-income households: -22.7% (-$9,440)
- Avg. earnings among 27 year-olds born in 1978 into low-income households: $41,582 (inflation-adjusted)
- Avg. earnings among 27 year-olds born in 1992 into low-income households: $32,142 (inflation-adjusted)
- 2023 unemployment rate: 2.7%
- Homeownership rate in 2022: 78.0%
- Poverty rate in 2022: 12.9%
- Total population: 7,814
36. Doniphan County, Kansas

- Long-term change in avg. earnings for 27 year-olds born into low-income households: -23.1% (-$9,892)
- Avg. earnings among 27 year-olds born in 1978 into low-income households: $42,896 (inflation-adjusted)
- Avg. earnings among 27 year-olds born in 1992 into low-income households: $33,004 (inflation-adjusted)
- 2023 unemployment rate: 2.5%
- Homeownership rate in 2022: 80.1%
- Poverty rate in 2022: 11.4%
- Total population: 7,501
35. Glades County, Florida

- Long-term change in avg. earnings for 27 year-olds born into low-income households: -23.1% (-$8,037)
- Avg. earnings among 27 year-olds born in 1978 into low-income households: $34,793 (inflation-adjusted)
- Avg. earnings among 27 year-olds born in 1992 into low-income households: $26,757 (inflation-adjusted)
- 2023 unemployment rate: 3.8%
- Homeownership rate in 2022: 78.4%
- Poverty rate in 2022: 21.9%
- Total population: 12,179
34. Mariposa County, California
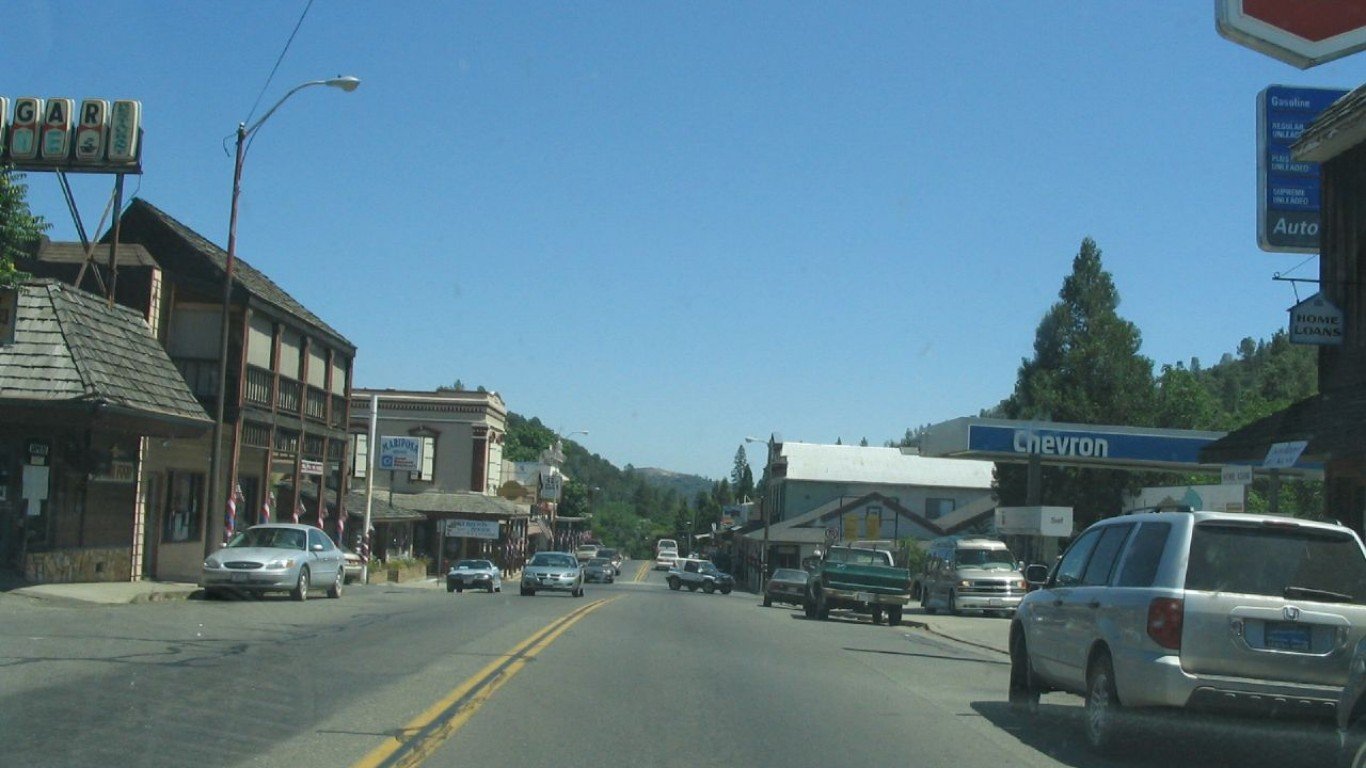
- Long-term change in avg. earnings for 27 year-olds born into low-income households: -23.1% (-$9,274)
- Avg. earnings among 27 year-olds born in 1978 into low-income households: $40,107 (inflation-adjusted)
- Avg. earnings among 27 year-olds born in 1992 into low-income households: $30,833 (inflation-adjusted)
- 2023 unemployment rate: 5.1%
- Homeownership rate in 2022: 73.8%
- Poverty rate in 2022: 16.0%
- Total population: 17,130
33. Haskell County, Oklahoma
- Long-term change in avg. earnings for 27 year-olds born into low-income households: -23.2% (-$9,072)
- Avg. earnings among 27 year-olds born in 1978 into low-income households: $39,064 (inflation-adjusted)
- Avg. earnings among 27 year-olds born in 1992 into low-income households: $29,992 (inflation-adjusted)
- 2023 unemployment rate: 4.8%
- Homeownership rate in 2022: 75.1%
- Poverty rate in 2022: 21.4%
- Total population: 11,651
32. Sibley County, Minnesota
- Long-term change in avg. earnings for 27 year-olds born into low-income households: -23.3% (-$11,846)
- Avg. earnings among 27 year-olds born in 1978 into low-income households: $50,852 (inflation-adjusted)
- Avg. earnings among 27 year-olds born in 1992 into low-income households: $39,005 (inflation-adjusted)
- 2023 unemployment rate: 3.3%
- Homeownership rate in 2022: 81.3%
- Poverty rate in 2022: 8.6%
- Total population: 14,950
31. Liberty County, Florida

- Long-term change in avg. earnings for 27 year-olds born into low-income households: -23.5% (-$8,668)
- Avg. earnings among 27 year-olds born in 1978 into low-income households: $36,824 (inflation-adjusted)
- Avg. earnings among 27 year-olds born in 1992 into low-income households: $28,157 (inflation-adjusted)
- 2023 unemployment rate: 3.3%
- Homeownership rate in 2022: 80.6%
- Poverty rate in 2022: 21.8%
- Total population: 7,704
30. Greenlee County, Arizona

- Long-term change in avg. earnings for 27 year-olds born into low-income households: -23.6% (-$9,607)
- Avg. earnings among 27 year-olds born in 1978 into low-income households: $40,709 (inflation-adjusted)
- Avg. earnings among 27 year-olds born in 1992 into low-income households: $31,102 (inflation-adjusted)
- 2023 unemployment rate: 2.9%
- Homeownership rate in 2022: 56.2%
- Poverty rate in 2022: 12.8%
- Total population: 9,483
29. Charles County, Maryland
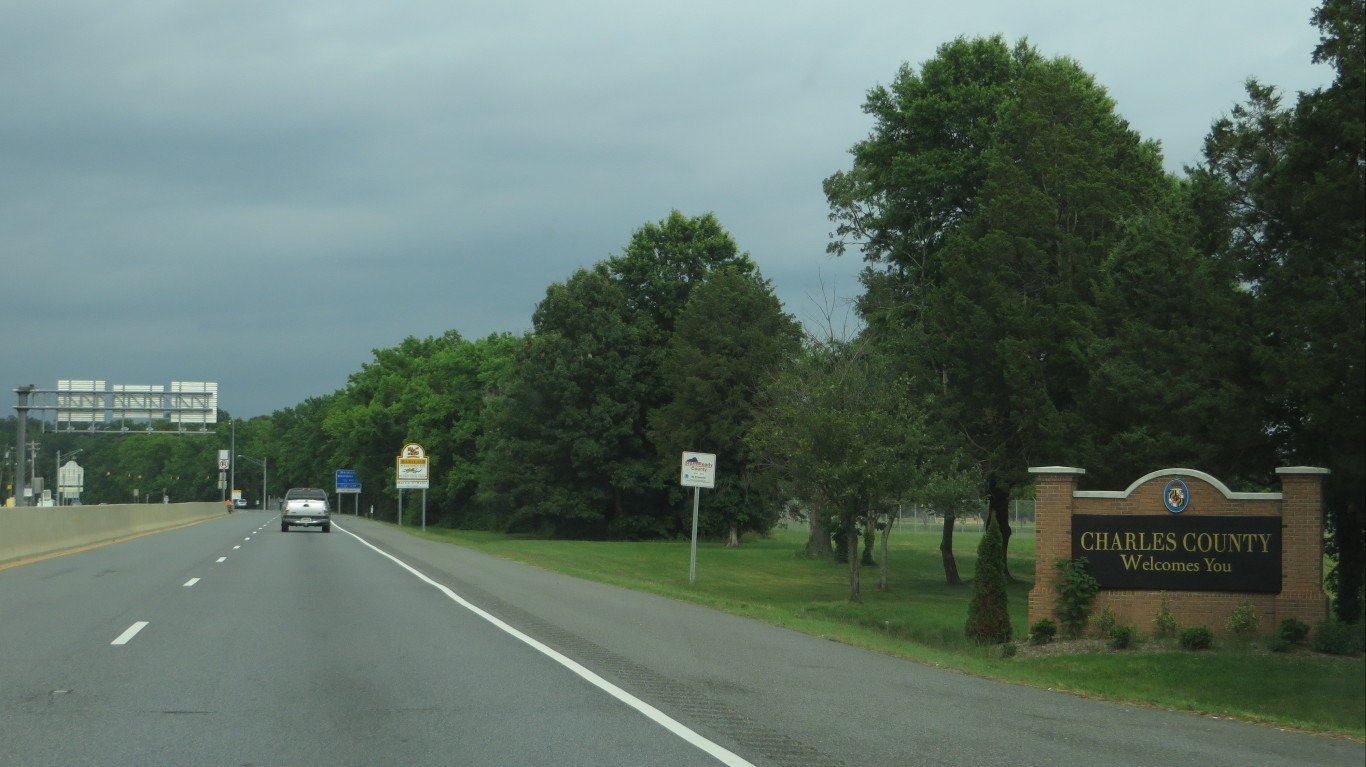
- Long-term change in avg. earnings for 27 year-olds born into low-income households: -23.9% (-$8,626)
- Avg. earnings among 27 year-olds born in 1978 into low-income households: $36,116 (inflation-adjusted)
- Avg. earnings among 27 year-olds born in 1992 into low-income households: $27,490 (inflation-adjusted)
- 2023 unemployment rate: 2.2%
- Homeownership rate in 2022: 79.8%
- Poverty rate in 2022: 5.9%
- Total population: 167,035
28. Morgan County, West Virginia

- Long-term change in avg. earnings for 27 year-olds born into low-income households: -24.0% (-$8,454)
- Avg. earnings among 27 year-olds born in 1978 into low-income households: $35,205 (inflation-adjusted)
- Avg. earnings among 27 year-olds born in 1992 into low-income households: $26,751 (inflation-adjusted)
- 2023 unemployment rate: 3.1%
- Homeownership rate in 2022: 84.3%
- Poverty rate in 2022: 10.6%
- Total population: 17,237
27. Colfax County, New Mexico
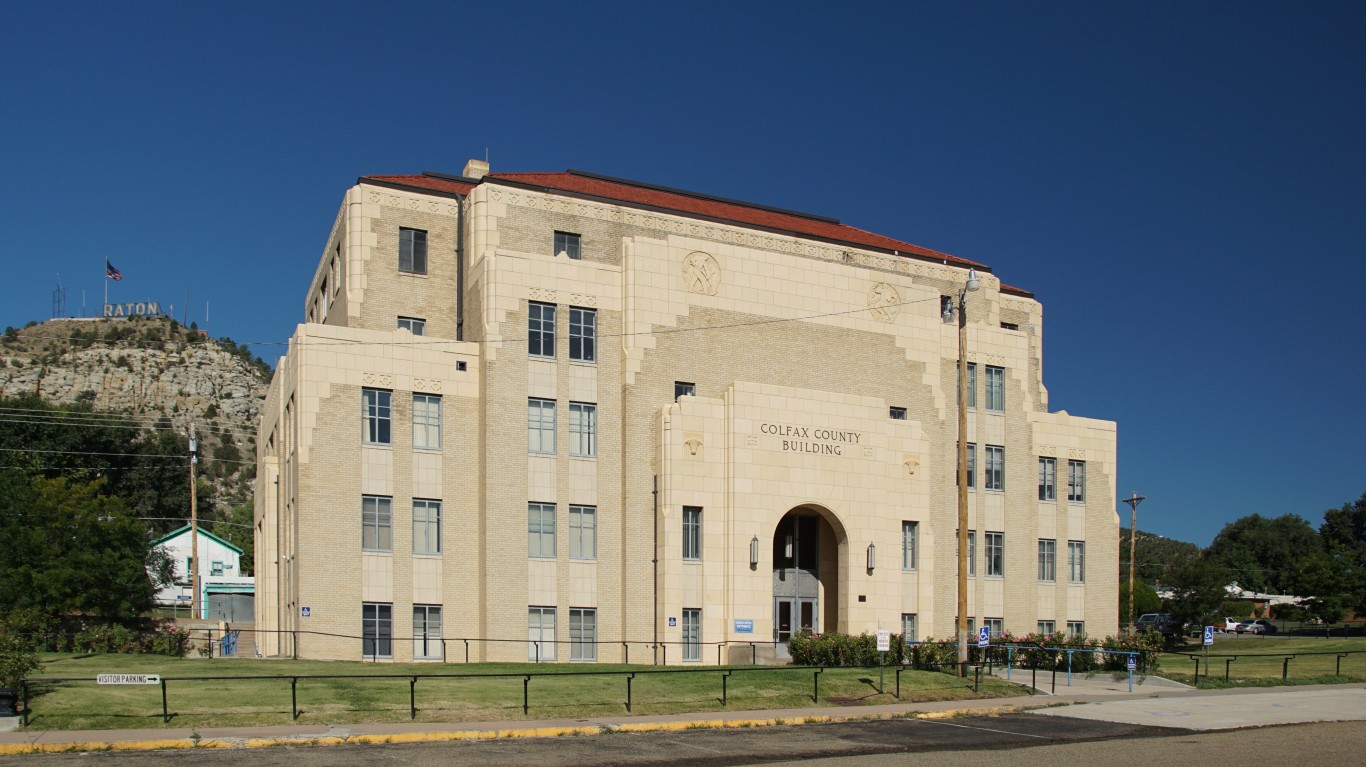
- Long-term change in avg. earnings for 27 year-olds born into low-income households: -24.1% (-$7,972)
- Avg. earnings among 27 year-olds born in 1978 into low-income households: $33,129 (inflation-adjusted)
- Avg. earnings among 27 year-olds born in 1992 into low-income households: $25,158 (inflation-adjusted)
- 2023 unemployment rate: 3.4%
- Homeownership rate in 2022: 71.7%
- Poverty rate in 2022: 18.1%
- Total population: 12,370
26. LaSalle Parish, Louisiana

- Long-term change in avg. earnings for 27 year-olds born into low-income households: -24.2% (-$10,465)
- Avg. earnings among 27 year-olds born in 1978 into low-income households: $43,331 (inflation-adjusted)
- Avg. earnings among 27 year-olds born in 1992 into low-income households: $32,867 (inflation-adjusted)
- 2023 unemployment rate: 3.0%
- Homeownership rate in 2022: 83.1%
- Poverty rate in 2022: 15.2%
- Total population: 14,764
25. Duchesne County, Utah
- Long-term change in avg. earnings for 27 year-olds born into low-income households: -24.3% (-$12,555)
- Avg. earnings among 27 year-olds born in 1978 into low-income households: $51,738 (inflation-adjusted)
- Avg. earnings among 27 year-olds born in 1992 into low-income households: $39,183 (inflation-adjusted)
- 2023 unemployment rate: 2.9%
- Homeownership rate in 2022: 77.3%
- Poverty rate in 2022: 13.5%
- Total population: 19,779
24. Buena Vista city, Virginia

- Long-term change in avg. earnings for 27 year-olds born into low-income households: -24.5% (-$8,466)
- Avg. earnings among 27 year-olds born in 1978 into low-income households: $34,596 (inflation-adjusted)
- Avg. earnings among 27 year-olds born in 1992 into low-income households: $26,130 (inflation-adjusted)
- 2023 unemployment rate: 2.7%
- Homeownership rate in 2022: 57.7%
- Poverty rate in 2022: 21.9%
- Total population: 6,639
23. Gallatin County, Kentucky

- Long-term change in avg. earnings for 27 year-olds born into low-income households: -24.8% (-$9,205)
- Avg. earnings among 27 year-olds born in 1978 into low-income households: $37,130 (inflation-adjusted)
- Avg. earnings among 27 year-olds born in 1992 into low-income households: $27,926 (inflation-adjusted)
- 2023 unemployment rate: 4.0%
- Homeownership rate in 2022: 70.5%
- Poverty rate in 2022: 16.8%
- Total population: 8,720
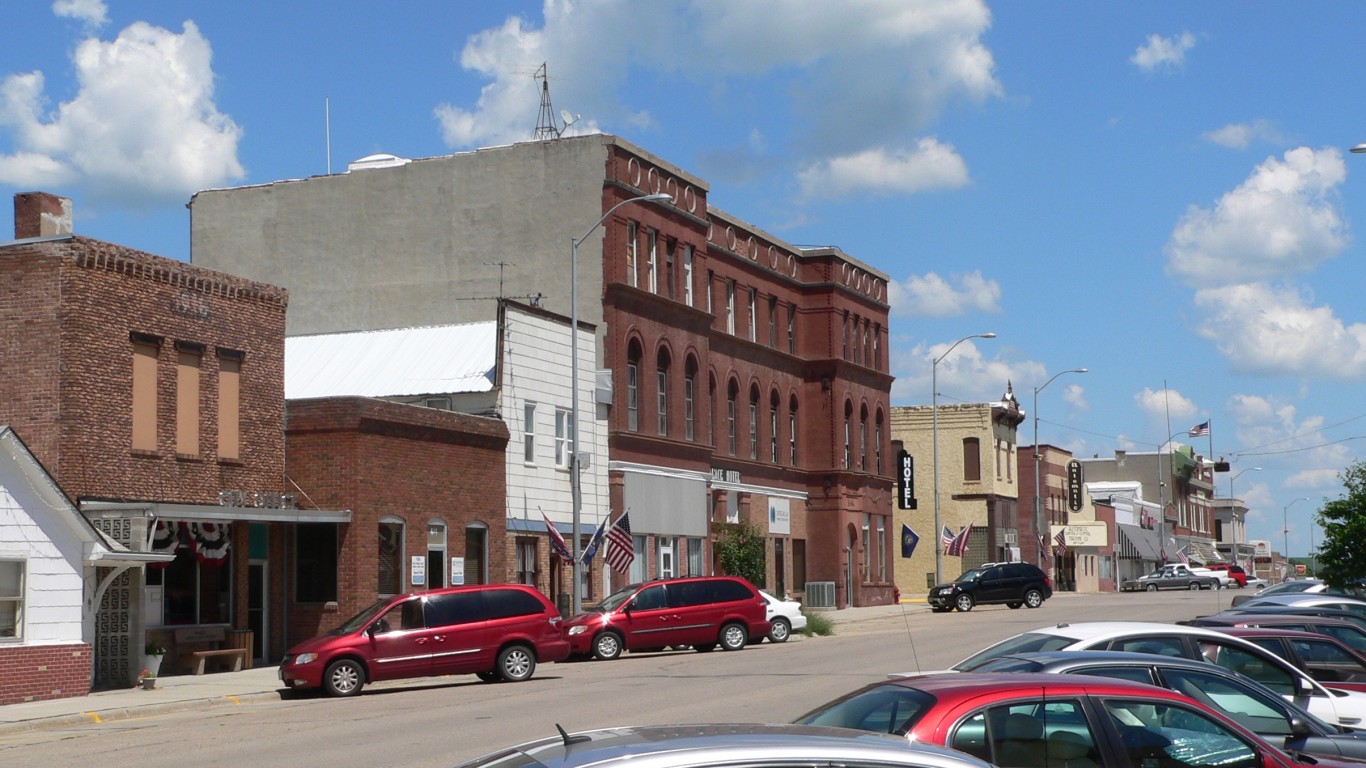
22. Moody County, South Dakota

- Long-term change in avg. earnings for 27 year-olds born into low-income households: -25.0% (-$11,285)
- Avg. earnings among 27 year-olds born in 1978 into low-income households: $45,083 (inflation-adjusted)
- Avg. earnings among 27 year-olds born in 1992 into low-income households: $33,799 (inflation-adjusted)
- 2023 unemployment rate: 2.0%
- Homeownership rate in 2022: 69.6%
- Poverty rate in 2022: 9.6%
- Total population: 6,346
21. Cleveland County, Arkansas

- Long-term change in avg. earnings for 27 year-olds born into low-income households: -25.1% (-$10,210)
- Avg. earnings among 27 year-olds born in 1978 into low-income households: $40,704 (inflation-adjusted)
- Avg. earnings among 27 year-olds born in 1992 into low-income households: $30,494 (inflation-adjusted)
- 2023 unemployment rate: 3.5%
- Homeownership rate in 2022: 83.6%
- Poverty rate in 2022: 13.6%
- Total population: 7,548
20. West Carroll Parish, Louisiana

- Long-term change in avg. earnings for 27 year-olds born into low-income households: -25.1% (-$10,192)
- Avg. earnings among 27 year-olds born in 1978 into low-income households: $40,537 (inflation-adjusted)
- Avg. earnings among 27 year-olds born in 1992 into low-income households: $30,345 (inflation-adjusted)
- 2023 unemployment rate: 6.2%
- Homeownership rate in 2022: 75.4%
- Poverty rate in 2022: 19.2%
- Total population: 9,800
19. Fremont County, Wyoming

- Long-term change in avg. earnings for 27 year-olds born into low-income households: -25.3% (-$10,266)
- Avg. earnings among 27 year-olds born in 1978 into low-income households: $40,586 (inflation-adjusted)
- Avg. earnings among 27 year-olds born in 1992 into low-income households: $30,320 (inflation-adjusted)
- 2023 unemployment rate: 3.4%
- Homeownership rate in 2022: 70.7%
- Poverty rate in 2022: 13.9%
- Total population: 39,402
18. Lyon County, Kentucky

- Long-term change in avg. earnings for 27 year-olds born into low-income households: -25.4% (-$9,490)
- Avg. earnings among 27 year-olds born in 1978 into low-income households: $37,404 (inflation-adjusted)
- Avg. earnings among 27 year-olds born in 1992 into low-income households: $27,914 (inflation-adjusted)
- 2023 unemployment rate: 4.4%
- Homeownership rate in 2022: 81.9%
- Poverty rate in 2022: 10.0%
- Total population: 8,721
17. Toole County, Montana

- Long-term change in avg. earnings for 27 year-olds born into low-income households: -25.8% (-$10,920)
- Avg. earnings among 27 year-olds born in 1978 into low-income households: $42,325 (inflation-adjusted)
- Avg. earnings among 27 year-olds born in 1992 into low-income households: $31,404 (inflation-adjusted)
- 2023 unemployment rate: 2.2%
- Homeownership rate in 2022: 64.9%
- Poverty rate in 2022: 10.6%
- Total population: 5,018
16. Ketchikan Gateway Borough, Alaska

- Long-term change in avg. earnings for 27 year-olds born into low-income households: -25.9% (-$9,978)
- Avg. earnings among 27 year-olds born in 1978 into low-income households: $38,464 (inflation-adjusted)
- Avg. earnings among 27 year-olds born in 1992 into low-income households: $28,486 (inflation-adjusted)
- 2023 unemployment rate: 3.7%
- Homeownership rate in 2022: 65.7%
- Poverty rate in 2022: 9.7%
- Total population: 13,910
15. Haskell County, Texas
- Long-term change in avg. earnings for 27 year-olds born into low-income households: -25.9% (-$11,017)
- Avg. earnings among 27 year-olds born in 1978 into low-income households: $42,461 (inflation-adjusted)
- Avg. earnings among 27 year-olds born in 1992 into low-income households: $31,443 (inflation-adjusted)
- 2023 unemployment rate: 3.8%
- Homeownership rate in 2022: 70.0%
- Poverty rate in 2022: 15.0%
- Total population: 5,408
14. Kenai Peninsula Borough, Alaska

- Long-term change in avg. earnings for 27 year-olds born into low-income households: -26.5% (-$10,626)
- Avg. earnings among 27 year-olds born in 1978 into low-income households: $40,172 (inflation-adjusted)
- Avg. earnings among 27 year-olds born in 1992 into low-income households: $29,546 (inflation-adjusted)
- 2023 unemployment rate: 4.7%
- Homeownership rate in 2022: 76.8%
- Poverty rate in 2022: 12.5%
- Total population: 59,235
13. Musselshell County, Montana
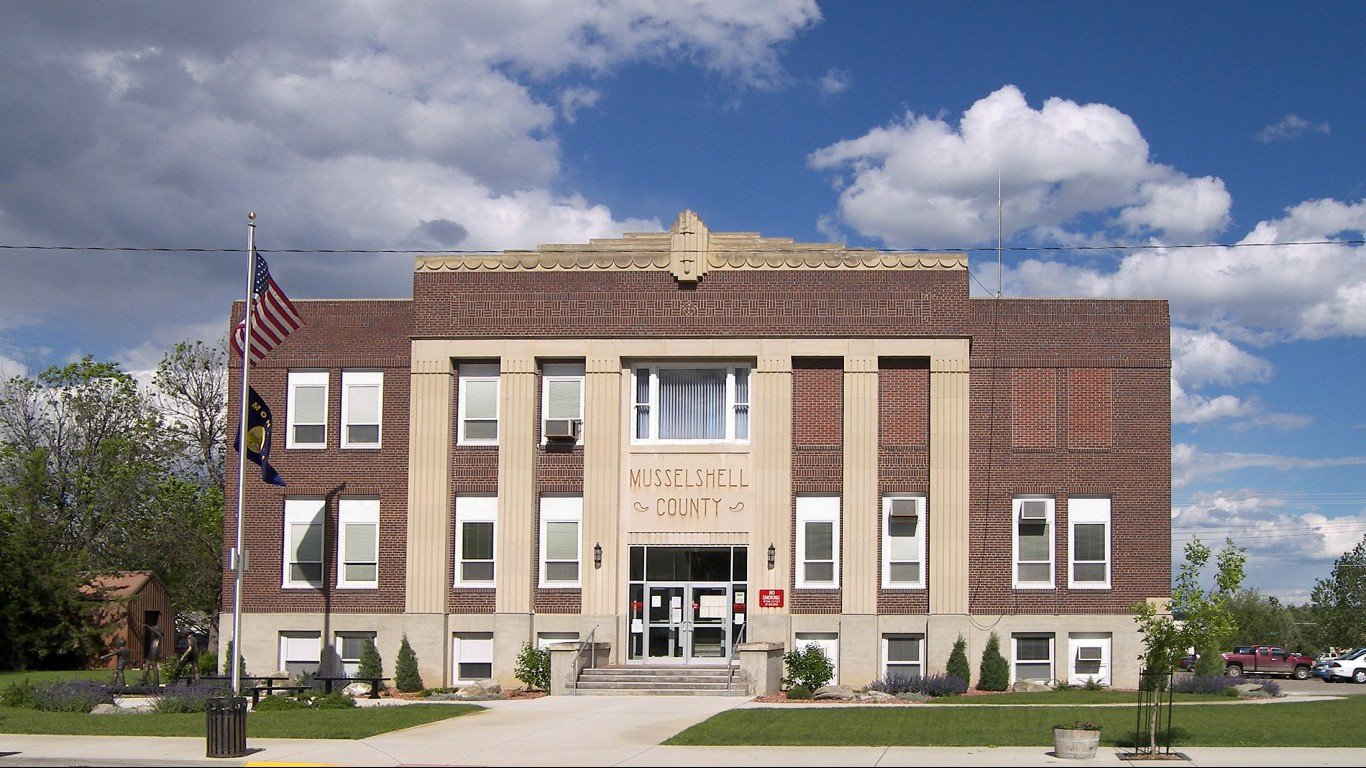
- Long-term change in avg. earnings for 27 year-olds born into low-income households: -26.5% (-$11,697)
- Avg. earnings among 27 year-olds born in 1978 into low-income households: $44,121 (inflation-adjusted)
- Avg. earnings among 27 year-olds born in 1992 into low-income households: $32,423 (inflation-adjusted)
- 2023 unemployment rate: 3.1%
- Homeownership rate in 2022: 80.8%
- Poverty rate in 2022: 11.8%
- Total population: 4,924
12. Latimer County, Oklahoma

- Long-term change in avg. earnings for 27 year-olds born into low-income households: -27.0% (-$10,713)
- Avg. earnings among 27 year-olds born in 1978 into low-income households: $39,736 (inflation-adjusted)
- Avg. earnings among 27 year-olds born in 1992 into low-income households: $29,024 (inflation-adjusted)
- 2023 unemployment rate: 4.7%
- Homeownership rate in 2022: 69.4%
- Poverty rate in 2022: 16.7%
- Total population: 9,537
11. Matanuska-Susitna Borough, Alaska

- Long-term change in avg. earnings for 27 year-olds born into low-income households: -27.7% (-$10,873)
- Avg. earnings among 27 year-olds born in 1978 into low-income households: $39,236 (inflation-adjusted)
- Avg. earnings among 27 year-olds born in 1992 into low-income households: $28,363 (inflation-adjusted)
- 2023 unemployment rate: 4.8%
- Homeownership rate in 2022: 76.5%
- Poverty rate in 2022: 10.2%
- Total population: 108,661
10. Colonial Heights city, Virginia

- Long-term change in avg. earnings for 27 year-olds born into low-income households: -28.4% (-$10,522)
- Avg. earnings among 27 year-olds born in 1978 into low-income households: $37,006 (inflation-adjusted)
- Avg. earnings among 27 year-olds born in 1992 into low-income households: $26,484 (inflation-adjusted)
- 2023 unemployment rate: 3.1%
- Homeownership rate in 2022: 66.4%
- Poverty rate in 2022: 10.2%
- Total population: 18,158
9. Uintah County, Utah

- Long-term change in avg. earnings for 27 year-olds born into low-income households: -29.1% (-$14,431)
- Avg. earnings among 27 year-olds born in 1978 into low-income households: $49,672 (inflation-adjusted)
- Avg. earnings among 27 year-olds born in 1992 into low-income households: $35,241 (inflation-adjusted)
- 2023 unemployment rate: 3.3%
- Homeownership rate in 2022: 73.7%
- Poverty rate in 2022: 11.6%
- Total population: 35,951
8. Walworth County, South Dakota
- Long-term change in avg. earnings for 27 year-olds born into low-income households: -29.4% (-$12,733)
- Avg. earnings among 27 year-olds born in 1978 into low-income households: $43,321 (inflation-adjusted)
- Avg. earnings among 27 year-olds born in 1992 into low-income households: $30,589 (inflation-adjusted)
- 2023 unemployment rate: 3.2%
- Homeownership rate in 2022: 73.4%
- Poverty rate in 2022: 13.2%
- Total population: 5,317
7. Dixie County, Florida

- Long-term change in avg. earnings for 27 year-olds born into low-income households: -29.6% (-$10,531)
- Avg. earnings among 27 year-olds born in 1978 into low-income households: $35,563 (inflation-adjusted)
- Avg. earnings among 27 year-olds born in 1992 into low-income households: $25,032 (inflation-adjusted)
- 2023 unemployment rate: 3.6%
- Homeownership rate in 2022: 83.0%
- Poverty rate in 2022: 16.1%
- Total population: 16,737
6. Roberts County, South Dakota

- Long-term change in avg. earnings for 27 year-olds born into low-income households: -30.0% (-$11,434)
- Avg. earnings among 27 year-olds born in 1978 into low-income households: $38,127 (inflation-adjusted)
- Avg. earnings among 27 year-olds born in 1992 into low-income households: $26,693 (inflation-adjusted)
- 2023 unemployment rate: 3.1%
- Homeownership rate in 2022: 67.9%
- Poverty rate in 2022: 20.8%
- Total population: 10,242
5. Letcher County, Kentucky
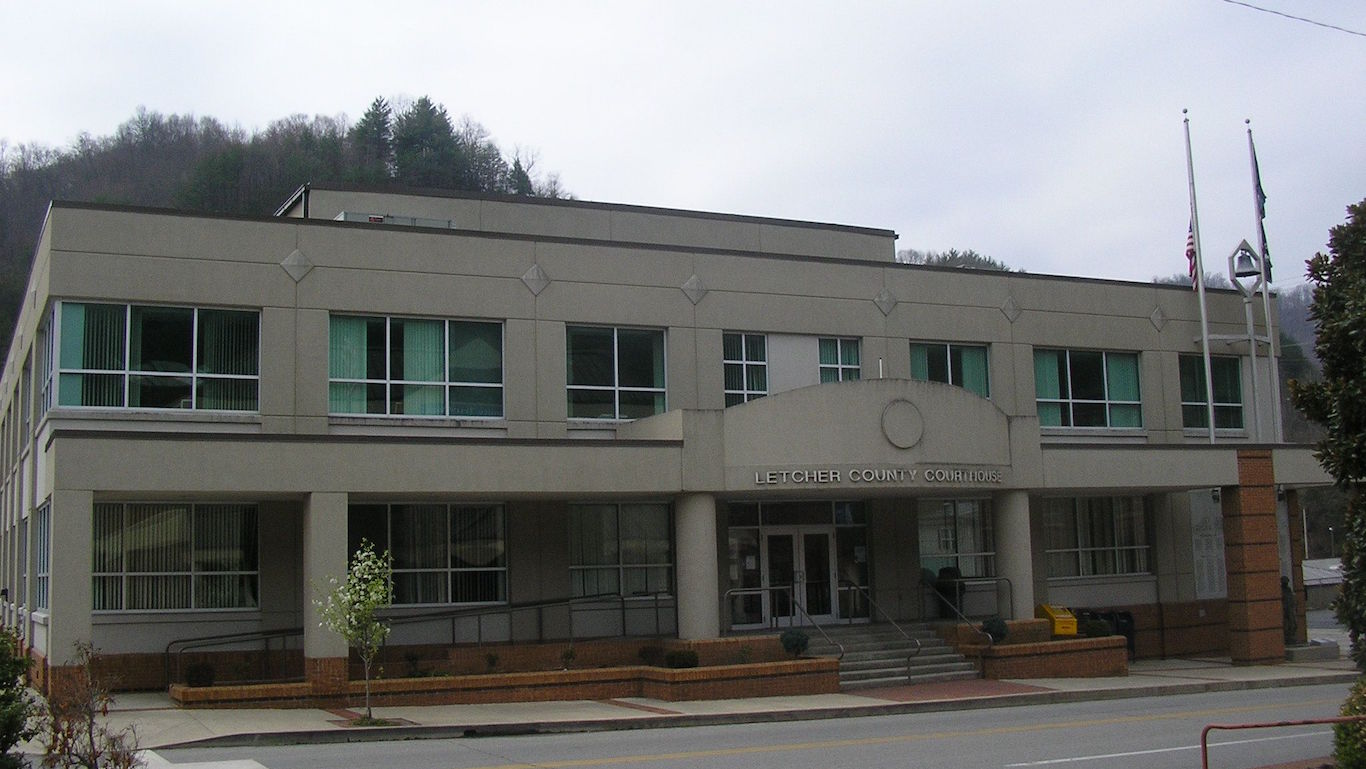
- Long-term change in avg. earnings for 27 year-olds born into low-income households: -30.2% (-$11,375)
- Avg. earnings among 27 year-olds born in 1978 into low-income households: $37,717 (inflation-adjusted)
- Avg. earnings among 27 year-olds born in 1992 into low-income households: $26,342 (inflation-adjusted)
Letcher County, Kentucky (continued)

- 2023 unemployment rate: 6.3%
- Homeownership rate in 2022: 74.0%
- Poverty rate in 2022: 29.0%
- Total population: 21,490
4. Thurston County, Nebraska
- Long-term change in avg. earnings for 27 year-olds born into low-income households: -32.5% (-$10,506)
- Avg. earnings among 27 year-olds born in 1978 into low-income households: $32,320 (inflation-adjusted)
- Avg. earnings among 27 year-olds born in 1992 into low-income households: $21,814 (inflation-adjusted)
Thurston County, Nebraska (continued)
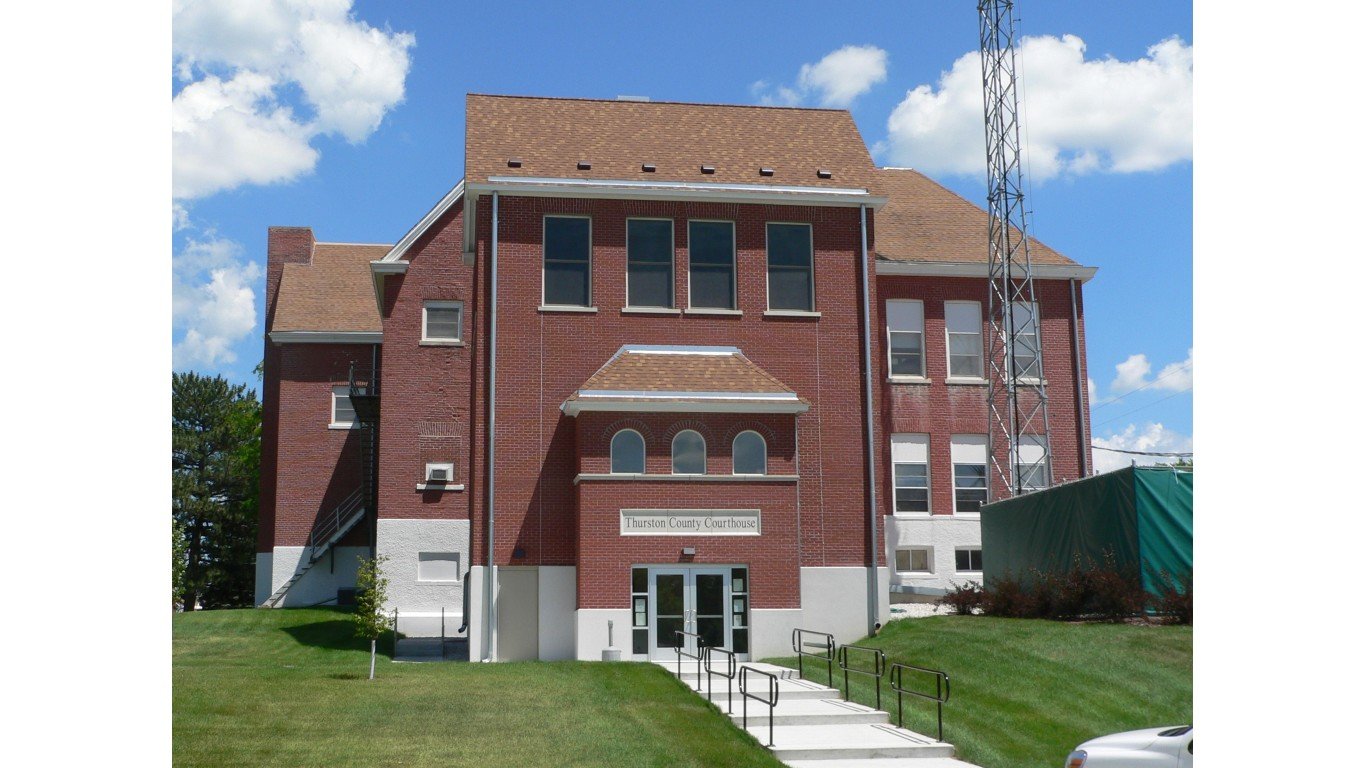
- 2023 unemployment rate: 2.7%
- Homeownership rate in 2022: 60.9%
- Poverty rate in 2022: 19.0%
- Total population: 6,716
3. Leslie County, Kentucky

- Long-term change in avg. earnings for 27 year-olds born into low-income households: -34.7% (-$13,923)
- Avg. earnings among 27 year-olds born in 1978 into low-income households: $40,151 (inflation-adjusted)
- Avg. earnings among 27 year-olds born in 1992 into low-income households: $26,227 (inflation-adjusted)
Leslie County, Kentucky (continued)
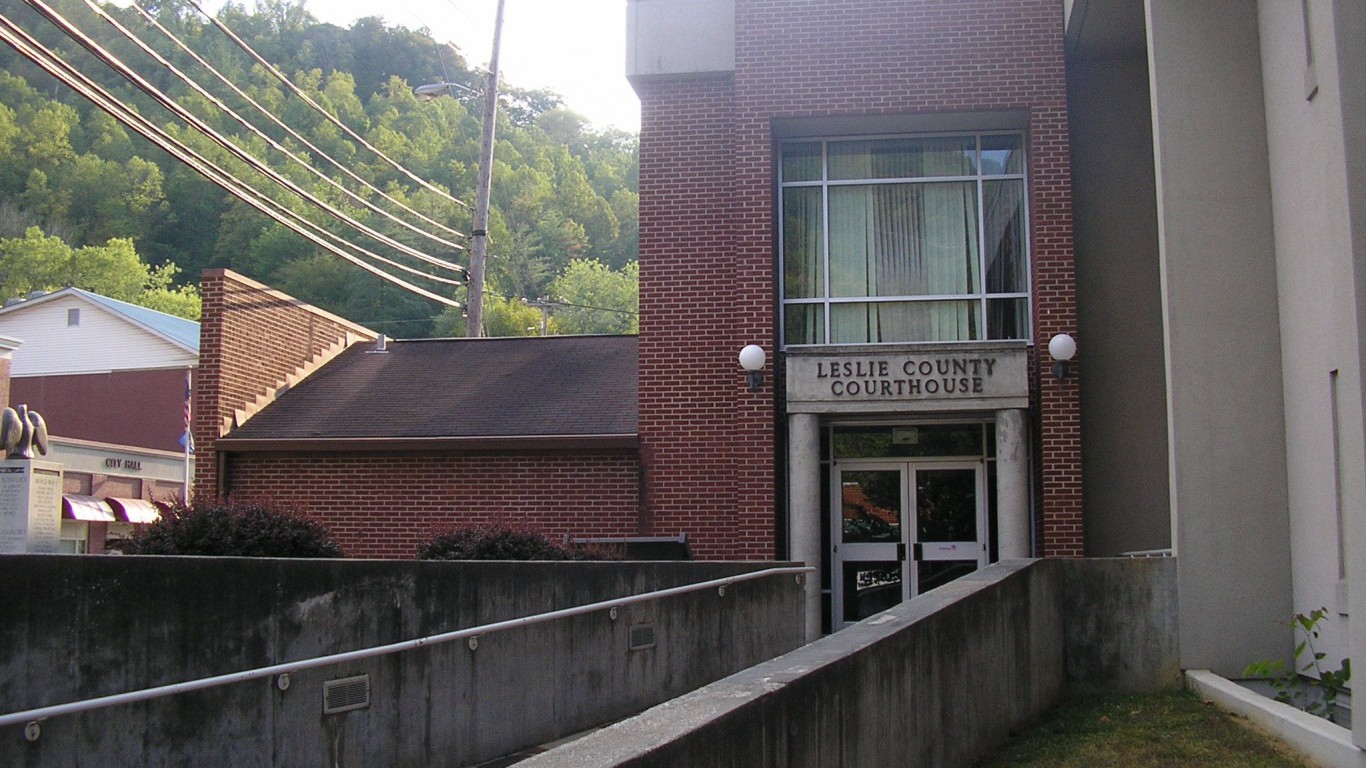
- 2023 unemployment rate: 6.9%
- Homeownership rate in 2022: 86.8%
- Poverty rate in 2022: 33.6%
- Total population: 10,468
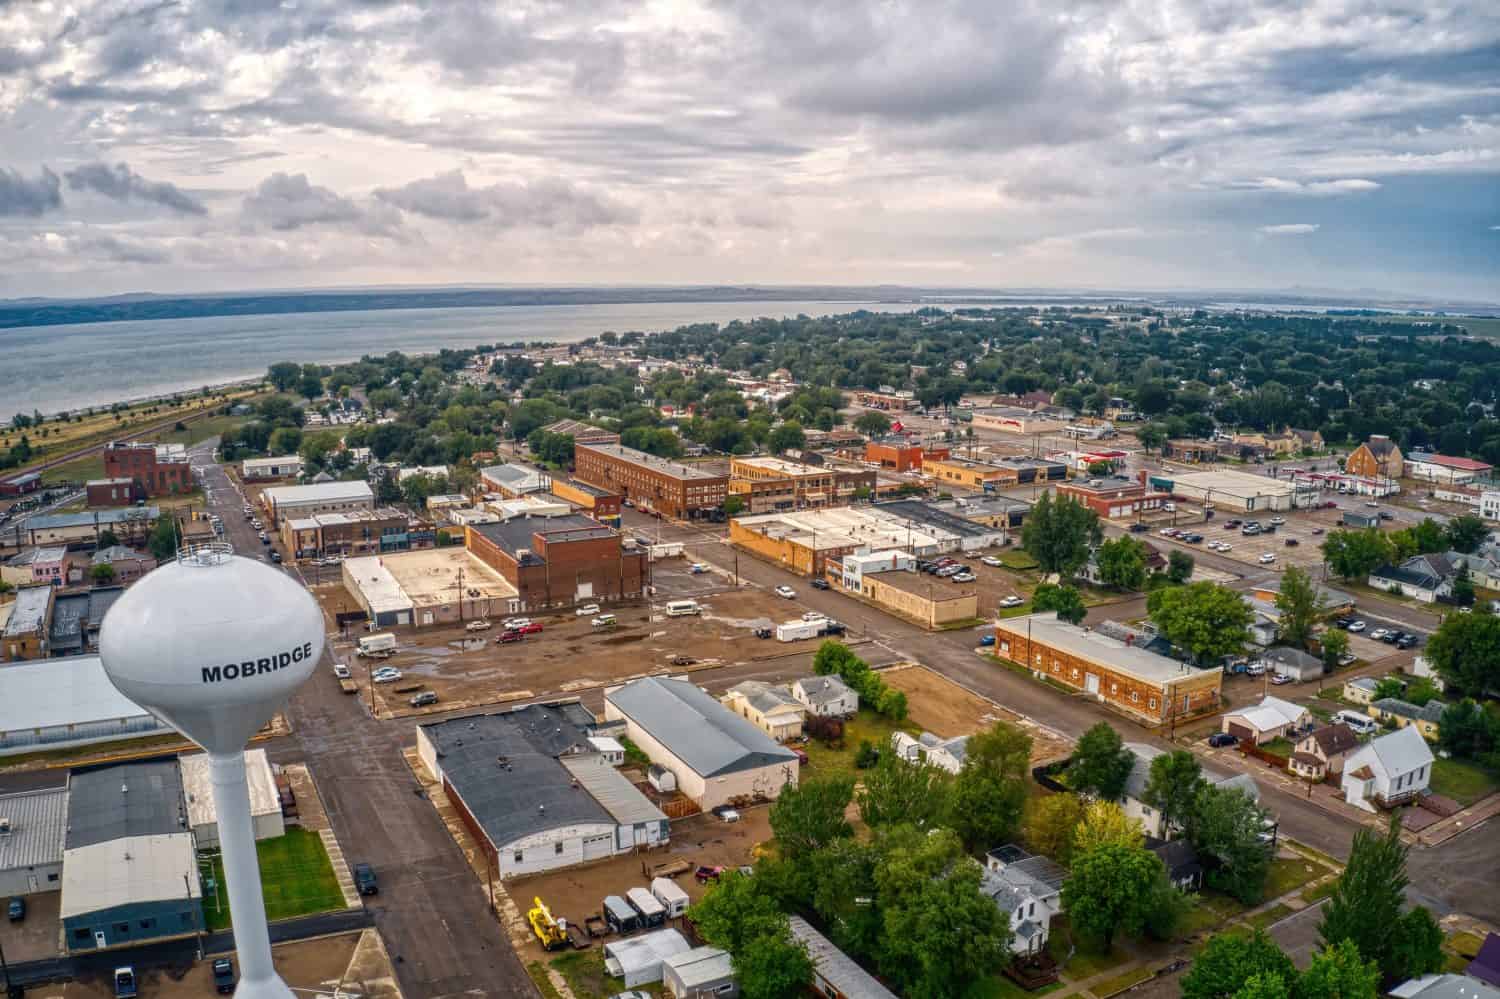
2. Charles Mix County, South Dakota
- Long-term change in avg. earnings for 27 year-olds born into low-income households: -38.2% (-$19,107)
- Avg. earnings among 27 year-olds born in 1978 into low-income households: $50,051 (inflation-adjusted)
- Avg. earnings among 27 year-olds born in 1992 into low-income households: $30,944 (inflation-adjusted)
Charles Mix County, South Dakota (continued)

- 2023 unemployment rate: 2.2%
- Homeownership rate in 2022: 73.9%
- Poverty rate in 2022: 22.9%
- Total population: 9,302
1. Bethel Census Area, Alaska
- Long-term change in avg. earnings for 27 year-olds born into low-income households: -48.4% (-$12,290)
- Avg. earnings among 27 year-olds born in 1978 into low-income households: $25,383 (inflation-adjusted)
- Avg. earnings among 27 year-olds born in 1992 into low-income households: $13,093 (inflation-adjusted)
Bethel Census Area, Alaska (continued)

- 2023 unemployment rate: 9.7%
- Homeownership rate in 2022: 59.0%
- Poverty rate in 2022: 25.3%
- Total population: 18,538
The post These Communities Have Waved Goodbye to The American Dream appeared first on 24/7 Wall St..