


Home Prices are Up Over 20% Year Over Year in These American Cities
Home prices have climbed at a historic pace in the United States in recent years. According to the Case-Shiller U.S. National Home Price Index, a typical single-family home is now about 50% more expensive than it was five years ago. A closer look at monthly median list prices shows that much of this increase was […] The post Home Prices are Up Over 20% Year Over Year in These American Cities appeared first on 24/7 Wall St..

Home prices have climbed at a historic pace in the United States in recent years. According to the Case-Shiller U.S. National Home Price Index, a typical single-family home is now about 50% more expensive than it was five years ago. A closer look at monthly median list prices shows that much of this increase was driven almost entirely by market forces during the COVID-19 pandemic, however.
Key Points
-
After years of surging home values, new data suggests that real estate prices may have finally plateaued.
-
Many parts of the U.S. have not followed this broader trend, however, and in dozens of American cities, home prices have spiked in the last year.
-
A house is the biggest investment millions of Americans will ever make, and a financial advisor can be the best way for those in the market to remain within their budget. Click here to get started now.
Data from Realtor.com shows that, at the beginning of the pandemic in March 2020, a typical home in the U.S. was listed for just $319,000. Rising steadily over the next two years, the median list price topped $400,000 for the first time in April 2022 — and has not fallen below that $400,000 threshold since.
As of April 2025, the latest month of available data, the typical home in the U.S. was listed for $431,250. While this is considerably less than the all-time-high of $449,000, reported in June 2022, it is not meaningfully different from the median list price reported one year ago.
Notably, however, real estate prices are, to a large extent, determined by local market forces — and while prices have remained relatively flat nationwide over the last year, in cities across the country home prices have climbed considerably over the last 12 months.
Using data from Realtor.com, 24/7 Wall St. identified the cities where home prices are surging. Metro areas are ranked on the relative change in median list prices from April 2024 to April 2025, the most recent one-year period of available data. Only metro areas where median list prices are up over 20% year-over-year were considered, and metro areas flagged by Realtor.com for possible data quality issues were excluded from analysis. All supplemental data in this story is also from Realtor.com.
Among the 32 cities on this list, home prices have increased by anywhere from 20.4% to nearly 50% over the last year. The majority of these cities — 17 out of 32 — are located in the Midwest, including three each in Illinois, Iowa, Kansas, and Missouri. Another eight cities on this list are in the South and five are in the West, while only two are located in the Northeast. (Here is a look at the states with the most expensive housing markets.)
Rising prices in these places may be due, at least in part, to the kinds of homes that are being put up for sale. Within any given market, larger homes often command higher prices, and in all but a handful of cities on this list, the typical listed home is larger than the typical home on the market was a year ago.
It is important to note that, despite rapidly rising list prices, the housing market remains relatively affordable in many of these cities. Of the 32 metro areas on this list, all but four have a median list price that is lower than the national median. (Here is a look at the least affordable housing market in every state.)
These are the cities where home prices are surging.
Why it Matters

Since the start of the COVID-19 pandemic, home prices have surged by 50%, but recent data suggests that list prices may finally be plateauing. Still, location matters when it comes to housing markets, and some parts of the country are still reporting substantial increases in home prices. According to Realtor.com, list prices are up by at least 20% in more than two dozen American cities.
32. Fort Dodge, IA

- 1-year change in median list price: +20.4% (+$32,350)
- Median home list price: $191,000 in April 2025, $158,650 in April 2024
- Median size of a listed home: 1,501 sq. ft. in April 2025, 1,420 sq. ft. in April 2024
- Median time on market for a listed home: 61 days in April 2025, 46 days in April 2024
- Total number of homes for sale: 146 in April 2025, 139 days in April 2024
31. Wilmington, OH

- 1-year change in median list price: +20.6% (+$52,935)
- Median home list price: $310,126 in April 2025, $257,191 in April 2024
- Median size of a listed home: 1,770 sq. ft. in April 2025, 1,770 sq. ft. in April 2024
- Median time on market for a listed home: 26 days in April 2025, 37 days in April 2024
- Total number of homes for sale: 117 in April 2025, 100 days in April 2024
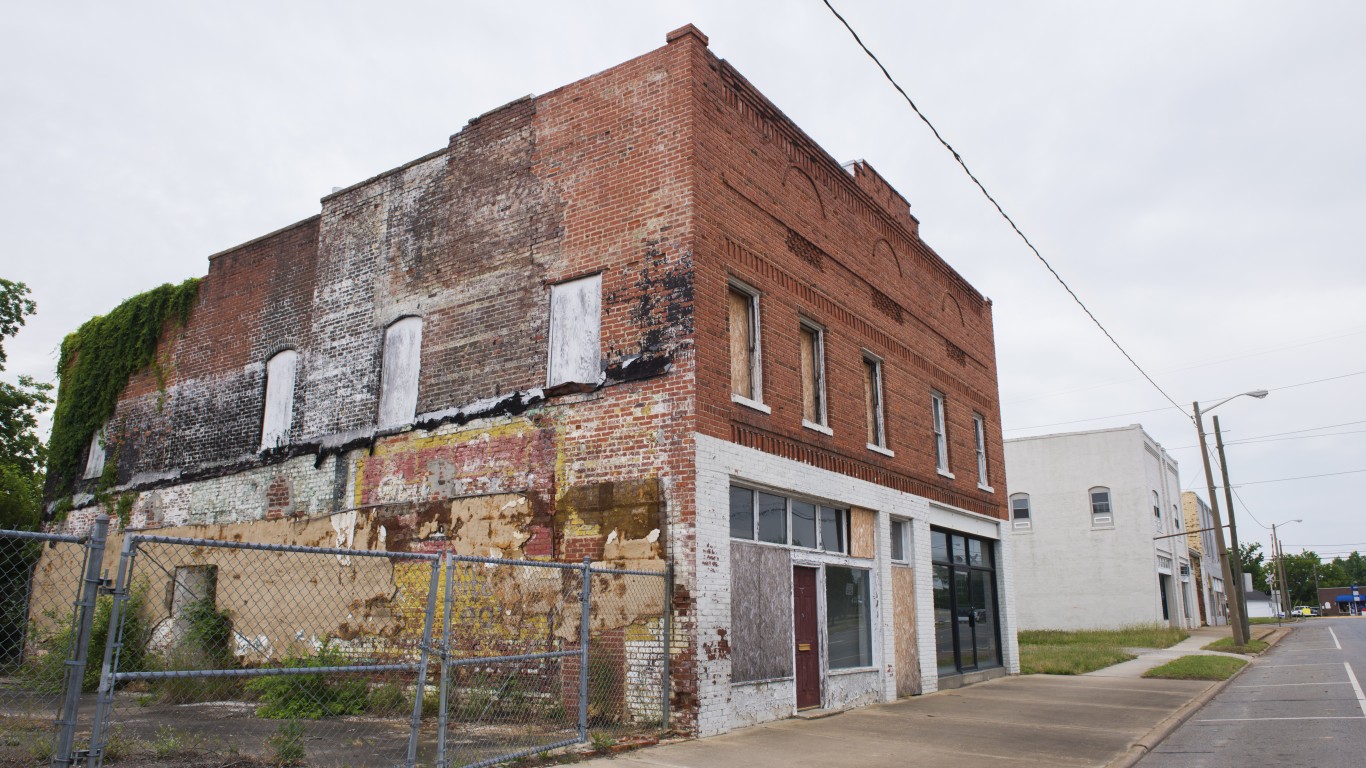
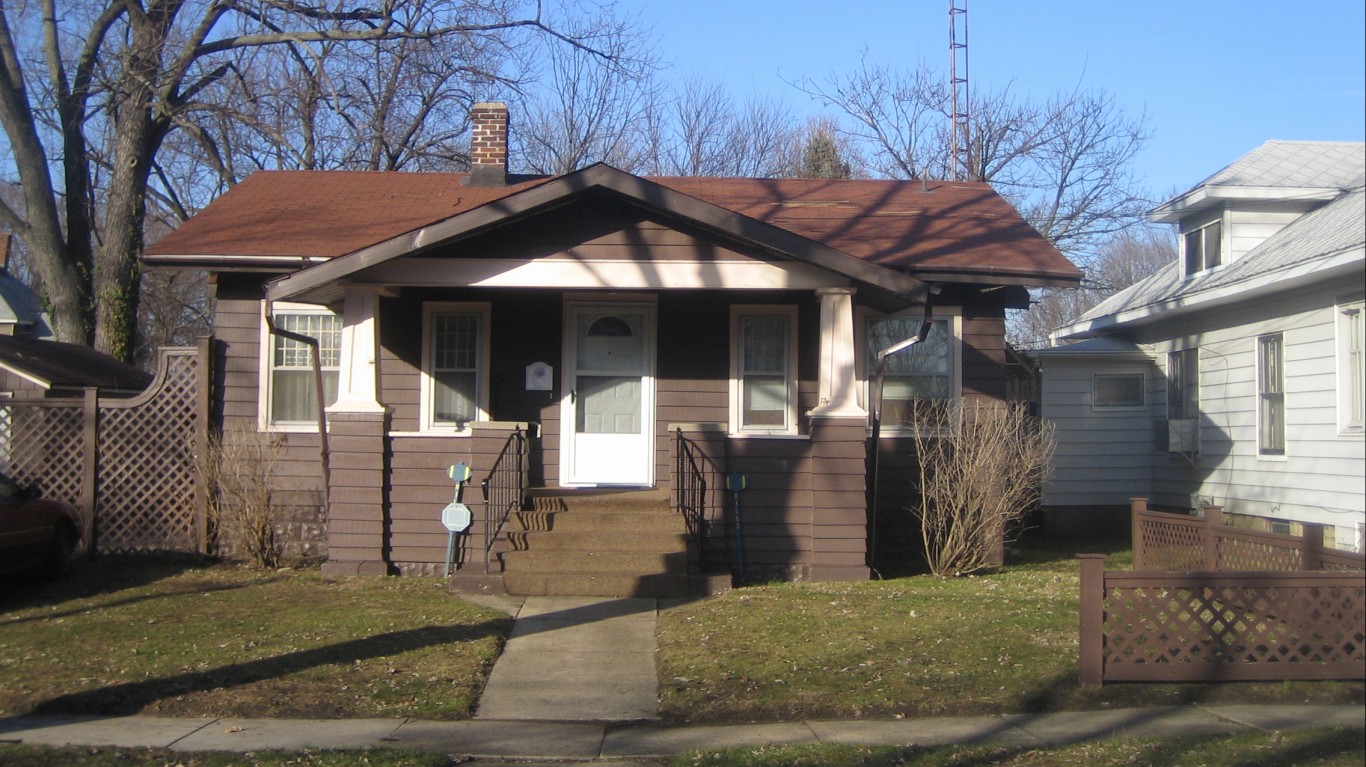
30. Peru, IN

- 1-year change in median list price: +21.1% (+$28,750)
- Median home list price: $164,950 in April 2025, $136,200 in April 2024
- Median size of a listed home: 1,704 sq. ft. in April 2025, 1,454 sq. ft. in April 2024
- Median time on market for a listed home: 54 days in April 2025, 40 days in April 2024
- Total number of homes for sale: 84 in April 2025, 69 days in April 2024
29. Hood River, OR

- 1-year change in median list price: +21.3% (+$173,750)
- Median home list price: $991,250 in April 2025, $817,500 in April 2024
- Median size of a listed home: 2,125 sq. ft. in April 2025, 1,868 sq. ft. in April 2024
- Median time on market for a listed home: 52 days in April 2025, 43 days in April 2024
- Total number of homes for sale: 60 in April 2025, 62 days in April 2024
28. Rock Springs, WY

- 1-year change in median list price: +21.3% (+$63,250)
- Median home list price: $360,750 in April 2025, $297,500 in April 2024
- Median size of a listed home: 2,289 sq. ft. in April 2025, 2,102 sq. ft. in April 2024
- Median time on market for a listed home: 37 days in April 2025, 32 days in April 2024
- Total number of homes for sale: 85 in April 2025, 72 days in April 2024
27. Marion-Herrin, IL

- 1-year change in median list price: +21.6% (+$39,025)
- Median home list price: $220,000 in April 2025, $180,975 in April 2024
- Median size of a listed home: 1,721 sq. ft. in April 2025, 1,628 sq. ft. in April 2024
- Median time on market for a listed home: 51 days in April 2025, 59 days in April 2024
- Total number of homes for sale: 295 in April 2025, 249 days in April 2024
26. Mason City, IA

- 1-year change in median list price: +21.9% (+$52,520)
- Median home list price: $292,195 in April 2025, $239,675 in April 2024
- Median size of a listed home: 2,084 sq. ft. in April 2025, 1,875 sq. ft. in April 2024
- Median time on market for a listed home: 83 days in April 2025, 50 days in April 2024
- Total number of homes for sale: 294 in April 2025, 235 days in April 2024
25. Danville, VA

- 1-year change in median list price: +22.3% (+$42,313)
- Median home list price: $232,425 in April 2025, $190,112 in April 2024
- Median size of a listed home: 1,556 sq. ft. in April 2025, 1,567 sq. ft. in April 2024
- Median time on market for a listed home: 45 days in April 2025, 52 days in April 2024
- Total number of homes for sale: 304 in April 2025, 254 days in April 2024
24. Sweetwater, TX

- 1-year change in median list price: +22.8% (+$32,475)
- Median home list price: $174,925 in April 2025, $142,450 in April 2024
- Median size of a listed home: 1,791 sq. ft. in April 2025, 1,869 sq. ft. in April 2024
- Median time on market for a listed home: 143 days in April 2025, 109 days in April 2024
- Total number of homes for sale: 88 in April 2025, 89 days in April 2024
23. Henderson, KY

- 1-year change in median list price: +23.0% (+$45,825)
- Median home list price: $244,950 in April 2025, $199,125 in April 2024
- Median size of a listed home: 1,734 sq. ft. in April 2025, 1,649 sq. ft. in April 2024
- Median time on market for a listed home: 53 days in April 2025, 48 days in April 2024
- Total number of homes for sale: 109 in April 2025, 82 days in April 2024
22. Oil City, PA

- 1-year change in median list price: +23.9% (+$34,150)
- Median home list price: $176,900 in April 2025, $142,750 in April 2024
- Median size of a listed home: 1,746 sq. ft. in April 2025, 1,752 sq. ft. in April 2024
- Median time on market for a listed home: 67 days in April 2025, 76 days in April 2024
- Total number of homes for sale: 125 in April 2025, 132 days in April 2024
21. Silver City, NM

- 1-year change in median list price: +24.9% (+$69,750)
- Median home list price: $349,500 in April 2025, $279,750 in April 2024
- Median size of a listed home: 1,869 sq. ft. in April 2025, 1,797 sq. ft. in April 2024
- Median time on market for a listed home: 84 days in April 2025, 72 days in April 2024
- Total number of homes for sale: 131 in April 2025, 114 days in April 2024
20. Newberry, SC

- 1-year change in median list price: +25.3% (+$82,095)
- Median home list price: $407,045 in April 2025, $324,950 in April 2024
- Median size of a listed home: 2,105 sq. ft. in April 2025, 2,105 sq. ft. in April 2024
- Median time on market for a listed home: 52 days in April 2025, 51 days in April 2024
- Total number of homes for sale: 115 in April 2025, 112 days in April 2024
19. Austin, MN
- 1-year change in median list price: +26.2% (+$57,500)
- Median home list price: $277,400 in April 2025, $219,900 in April 2024
- Median size of a listed home: 1,908 sq. ft. in April 2025, 1,672 sq. ft. in April 2024
- Median time on market for a listed home: 32 days in April 2025, 36 days in April 2024
- Total number of homes for sale: 109 in April 2025, 85 days in April 2024
18. Roanoke Rapids, NC
- 1-year change in median list price: +26.6% (+$66,450)
- Median home list price: $315,950 in April 2025, $249,500 in April 2024
- Median size of a listed home: 1,660 sq. ft. in April 2025, 1,759 sq. ft. in April 2024
- Median time on market for a listed home: 57 days in April 2025, 46 days in April 2024
- Total number of homes for sale: 222 in April 2025, 187 days in April 2024
17. Andrews, TX

- 1-year change in median list price: +26.7% (+$80,500)
- Median home list price: $382,475 in April 2025, $301,975 in April 2024
- Median size of a listed home: 2,141 sq. ft. in April 2025, 2,042 sq. ft. in April 2024
- Median time on market for a listed home: 37 days in April 2025, 51 days in April 2024
- Total number of homes for sale: 58 in April 2025, 64 days in April 2024
16. Mayfield, KY

- 1-year change in median list price: +28.1% (+$59,600)
- Median home list price: $272,000 in April 2025, $212,400 in April 2024
- Median size of a listed home: 1,800 sq. ft. in April 2025, 1,645 sq. ft. in April 2024
- Median time on market for a listed home: 69 days in April 2025, 49 days in April 2024
- Total number of homes for sale: 96 in April 2025, 101 days in April 2024
15. Syracuse, NY

- 1-year change in median list price: +28.2% (+$76,725)
- Median home list price: $349,225 in April 2025, $272,500 in April 2024
- Median size of a listed home: 1,708 sq. ft. in April 2025, 1,641 sq. ft. in April 2024
- Median time on market for a listed home: 56 days in April 2025, 55 days in April 2024
- Total number of homes for sale: 1,519 in April 2025, 1,542 days in April 2024
14. Niles, MI
- 1-year change in median list price: +28.7% (+$98,475)
- Median home list price: $442,225 in April 2025, $343,750 in April 2024
- Median size of a listed home: 1,962 sq. ft. in April 2025, 1,841 sq. ft. in April 2024
- Median time on market for a listed home: 43 days in April 2025, 45 days in April 2024
- Total number of homes for sale: 604 in April 2025, 532 days in April 2024
13. Sikeston, MO

- 1-year change in median list price: +31.2% (+$41,825)
- Median home list price: $175,950 in April 2025, $134,125 in April 2024
- Median size of a listed home: 1,615 sq. ft. in April 2025, 1,396 sq. ft. in April 2024
- Median time on market for a listed home: 73 days in April 2025, 75 days in April 2024
- Total number of homes for sale: 162 in April 2025, 172 days in April 2024
12. Atchison, KS
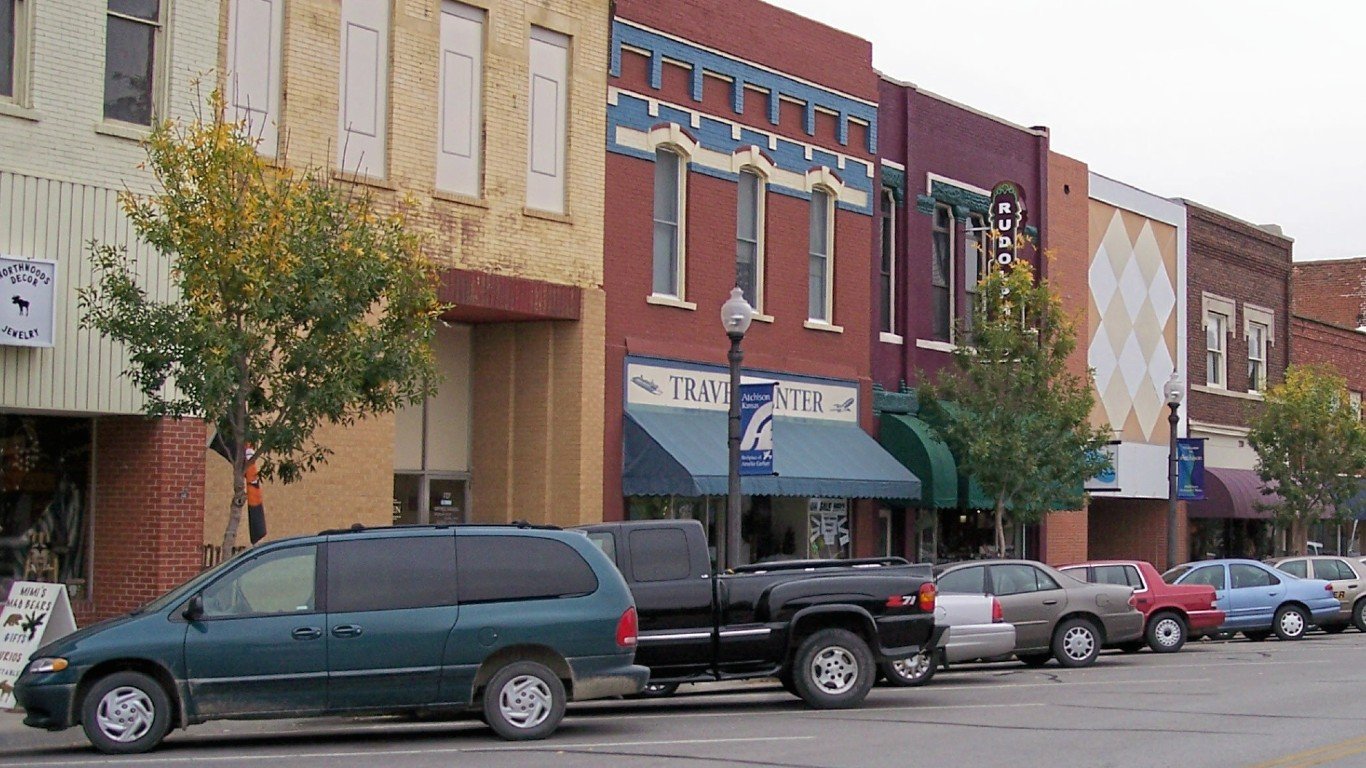
- 1-year change in median list price: +31.9% (+$46,875)
- Median home list price: $193,750 in April 2025, $146,875 in April 2024
- Median size of a listed home: 1,681 sq. ft. in April 2025, 1,551 sq. ft. in April 2024
- Median time on market for a listed home: 54 days in April 2025, 44 days in April 2024
- Total number of homes for sale: 43 in April 2025, 44 days in April 2024
11. Rochelle, IL

- 1-year change in median list price: +33.2% (+$71,030)
- Median home list price: $284,730 in April 2025, $213,700 in April 2024
- Median size of a listed home: 1,926 sq. ft. in April 2025, 1,868 sq. ft. in April 2024
- Median time on market for a listed home: 39 days in April 2025, 38 days in April 2024
- Total number of homes for sale: 111 in April 2025, 113 days in April 2024
10. Jamestown, ND

- 1-year change in median list price: +33.5% (+$61,525)
- Median home list price: $245,000 in April 2025, $183,475 in April 2024
- Median size of a listed home: 2,039 sq. ft. in April 2025, 2,075 sq. ft. in April 2024
- Median time on market for a listed home: 73 days in April 2025, 57 days in April 2024
- Total number of homes for sale: 54 in April 2025, 57 days in April 2024
9. Hutchinson, KS
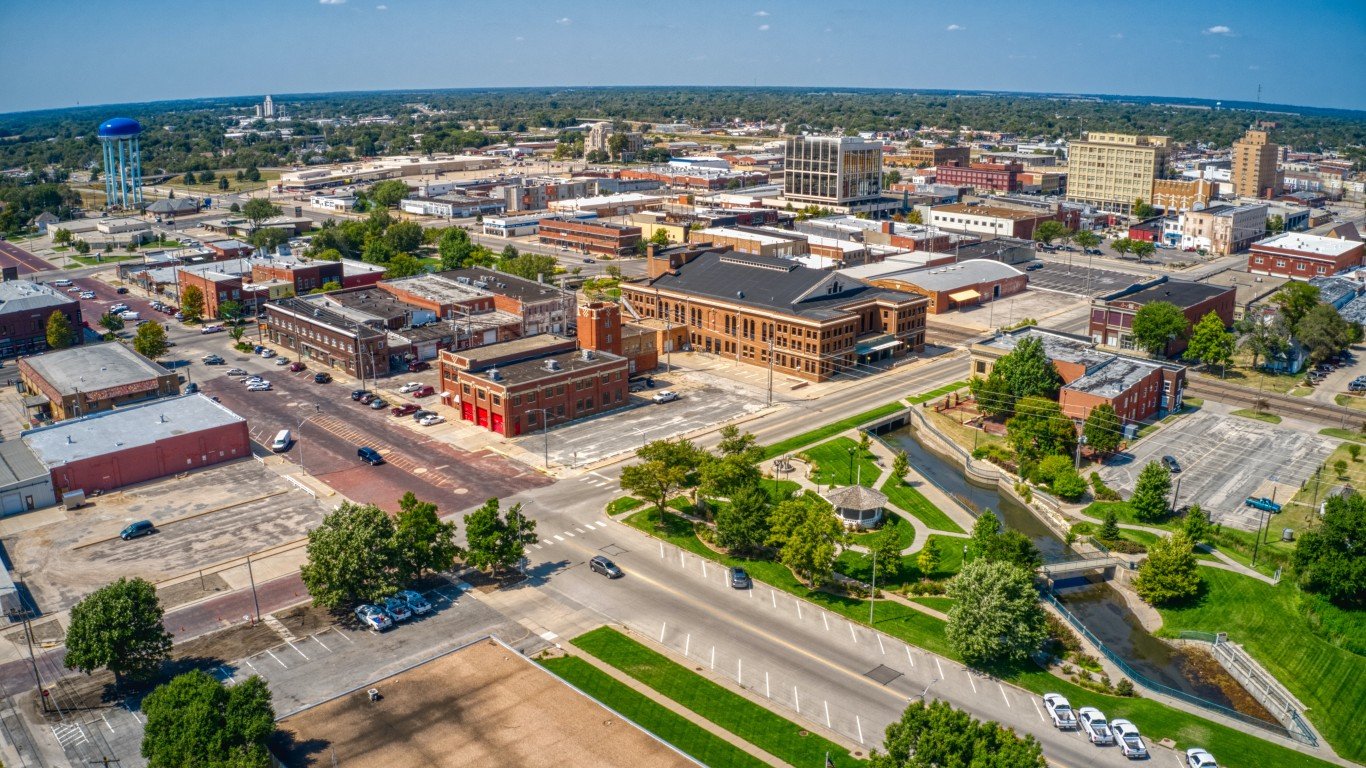
- 1-year change in median list price: +34.6% (+$53,450)
- Median home list price: $207,900 in April 2025, $154,450 in April 2024
- Median size of a listed home: 2,016 sq. ft. in April 2025, 1,652 sq. ft. in April 2024
- Median time on market for a listed home: 41 days in April 2025, 40 days in April 2024
- Total number of homes for sale: 184 in April 2025, 167 days in April 2024
8. Pontiac, IL

- 1-year change in median list price: +35.0% (+$45,850)
- Median home list price: $177,000 in April 2025, $131,150 in April 2024
- Median size of a listed home: 1,683 sq. ft. in April 2025, 1,621 sq. ft. in April 2024
- Median time on market for a listed home: 61 days in April 2025, 66 days in April 2024
- Total number of homes for sale: 89 in April 2025, 66 days in April 2024
7. Marshalltown, IA

- 1-year change in median list price: +35.2% (+$57,225)
- Median home list price: $219,675 in April 2025, $162,450 in April 2024
- Median size of a listed home: 1,380 sq. ft. in April 2025, 1,346 sq. ft. in April 2024
- Median time on market for a listed home: 33 days in April 2025, 34 days in April 2024
- Total number of homes for sale: 152 in April 2025, 111 days in April 2024
6. Riverton, WY

- 1-year change in median list price: +36.0% (+$136,000)
- Median home list price: $513,500 in April 2025, $377,500 in April 2024
- Median size of a listed home: 1,991 sq. ft. in April 2025, 2,089 sq. ft. in April 2024
- Median time on market for a listed home: 68 days in April 2025, 69 days in April 2024
- Total number of homes for sale: 135 in April 2025, 149 days in April 2024
5. St. Joseph, MO-KS

- 1-year change in median list price: +36.7% (+$63,050)
- Median home list price: $234,950 in April 2025, $171,900 in April 2024
- Median size of a listed home: 1,573 sq. ft. in April 2025, 1,576 sq. ft. in April 2024
- Median time on market for a listed home: 43 days in April 2025, 47 days in April 2024
- Total number of homes for sale: 340 in April 2025, 326 days in April 2024
4. Hailey, ID

- 1-year change in median list price: +38.4% (+$443,762)
- Median home list price: $1,601,000 in April 2025, $1,157,238 in April 2024
- Median size of a listed home: 2,215 sq. ft. in April 2025, 2,051 sq. ft. in April 2024
- Median time on market for a listed home: 76 days in April 2025, 70 days in April 2024
- Total number of homes for sale: 259 in April 2025, 247 days in April 2024
3. El Dorado, AR

- 1-year change in median list price: +41.2% (+$87,250)
- Median home list price: $299,250 in April 2025, $212,000 in April 2024
- Median size of a listed home: 2,497 sq. ft. in April 2025, 2,124 sq. ft. in April 2024
- Median time on market for a listed home: 55 days in April 2025, 69 days in April 2024
- Total number of homes for sale: 105 in April 2025, 107 days in April 2024
2. Great Bend, KS

- 1-year change in median list price: +44.8% (+$58,250)
- Median home list price: $188,250 in April 2025, $130,000 in April 2024
- Median size of a listed home: 1,728 sq. ft. in April 2025, 1,646 sq. ft. in April 2024
- Median time on market for a listed home: 59 days in April 2025, 74 days in April 2024
- Total number of homes for sale: 97 in April 2025, 63 days in April 2024
1. Moberly, MO
- 1-year change in median list price: +49.7% (+$74,625)
- Median home list price: $224,725 in April 2025, $150,100 in April 2024
- Median size of a listed home: 1,771 sq. ft. in April 2025, 1,333 sq. ft. in April 2024
- Median time on market for a listed home: 56 days in April 2025, 73 days in April 2024
- Total number of homes for sale: 112 in April 2025, 86 days in April 2024
The post Home Prices are Up Over 20% Year Over Year in These American Cities appeared first on 24/7 Wall St..